n8n Native OpenTelemetry Integration: Workflow and Node-Level Tracing

n8n launches native OpenTelemetry tracing, generating a root span per workflow execution and optional node child spans to accelerate incident diagnosis and performance optimization.
n8n released native OpenTelemetry tracing capabilities on June 8, enabling teams to fully trace every downstream action of each workflow execution from the trigger. The feature generates a root span per run recording the end-to-end path, status, and duration, with optional child spans per node to identify exactly which step is slow or failing. Traces can be exported to any OTLP-compatible collector and backend, including Jaeger, Tempo, Datadog, Honeycomb, New Relic, and Grafana Cloud. Configuration is at Settings > OpenTelemetry, with custom span attributes at the project, workflow, and node levels. The core value is faster incident diagnosis and more targeted performance optimization, while letting enterprises with existing OTLP observability systems reuse their current environment.
Workflow automation platform n8n has officially launched native OpenTelemetry tracing capabilities, enabling teams to fully trace every downstream action of each workflow execution starting from the trigger. This feature, released on June 8, generates a trace for each workflow run, with optional child spans for each node, providing an observability perspective for production-grade automations that connect CRMs, payment systems, API gateways, and AI agents.
Why Workflows Need Native Tracing
Once automation spans multiple applications, troubleshooting failures becomes exceptionally difficult. A failed run could be caused by a slow external API, an incorrectly mapped data field, a payment event, or some downstream step in the process. Without end-to-end tracing, teams often only see the result of "failure" without being able to quickly answer "which step failed, why did it fail, and where is the time being spent."
n8n's native OpenTelemetry support directly addresses this pain point. It can send execution data to compatible observability backends, allowing teams to investigate workflow behavior alongside the rest of their software stack. For enterprises that rely on n8n to move data between applications, the automation itself is part of the business process, and latency or errors can directly impact lead processing, customer communication, payment flows, and internal data updates.
OpenTelemetry (abbreviated as OTel) is an open-source observability standard under CNCF, designed to unify the collection and transmission protocols for three types of telemetry data: traces, metrics, and logs. It consists of a set of APIs, SDKs, and tools that allow applications to generate and export telemetry data without being bound to a specific vendor. Its data export protocol, OTLP (OpenTelemetry Protocol), defines the standard communication format between collectors and backends, and has become the common language in the observability domain.
In this system, a trace represents the complete lifecycle of a request or transaction, composed of several spans: each span records an operation with a start and end time, and carries a name, attributes, events, and status. Spans form a directed acyclic graph through parent-child relationships, thereby reconstructing the entire call chain. n8n models "one workflow execution" as a trace and "a single node execution" as a child span within it, thus directly aligning with the industry-standard observability data model without inventing a proprietary set of concepts.
How Workflow-Level and Node-Level Tracing Differ
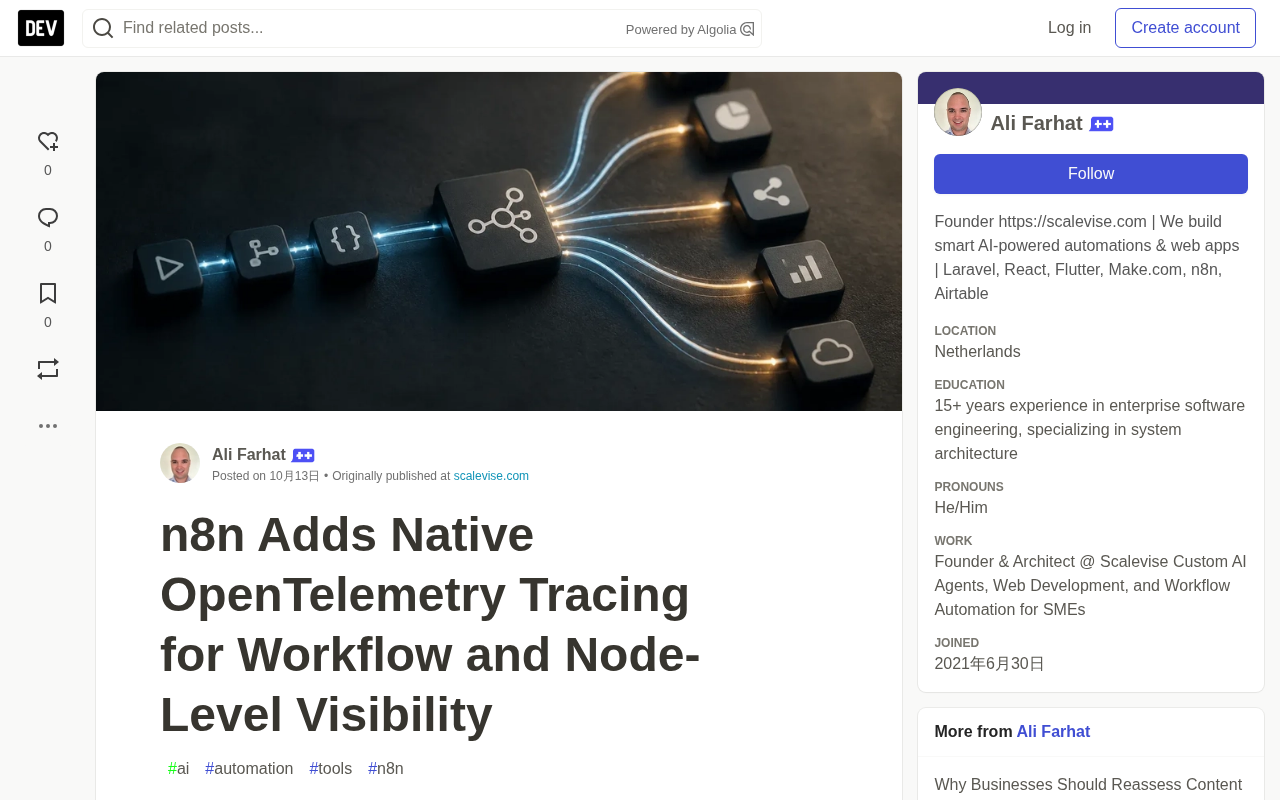
n8n's tracing is divided into two complementary levels. Every workflow execution produces a root span, serving as the top-level record of that execution, showing the end-to-end path, status, and total duration. If enabled, users can also generate child spans for each workflow node.
| Tracing Level | Data Emitted by n8n | Practical Use |
|---|---|---|
| Workflow execution | One root span per execution | Trace the end-to-end path, status, and duration of the automation |
| Single node | Optional child span per node | Identify which specific step is slow or failing |
The root span establishes the macro execution path, while node spans explain the specific outcome. For example, in a workflow that receives a customer request, queries a database, updates a CRM, and sends a response, node-level tracing can clearly reveal which step caused the delay or failure. This distinction turns automation from an opaque black-box task into a collection of components that can be broken down and analyzed layer by layer.
Supported Observability Backends and Configuration
n8n states that its traces can be exported to any OTLP-compatible collector and backend, with officially listed supported targets including Jaeger, Tempo, Datadog, Honeycomb, New Relic, and Grafana Cloud. This means enterprises that already have an OpenTelemetry observability system can directly reuse their existing environment to handle workflow traces, without introducing a separate proprietary monitoring layer.
The configuration entry is located at Settings > OpenTelemetry. The documentation covers trace export, as well as custom span attributes that can be applied at the project, workflow, and node levels. These attributes appear in the connected observability backend, allowing teams to filter and investigate execution records by project, workflow, or specific steps of interest. This makes the feature more than just basic execution logs—it generates trace data that can be queried and analyzed in professional operations tools.
OTLP-compatible backends refer to services or collectors that receive telemetry data following the OpenTelemetry Protocol. There are two common forms: one is the open-source collector OpenTelemetry Collector, responsible for receiving, processing, and forwarding data; the other is commercial or open-source backends with built-in OTLP endpoints, such as the Jaeger (distributed tracing), Tempo (Grafana ecosystem tracing backend), Datadog, Honeycomb, New Relic, and Grafana Cloud listed in the article.
The reason for emphasizing "compatible" rather than "specified" is that as long as n8n emits data according to the standard protocol, enterprises can reuse their existing collection pipelines and visualization dashboards without deploying a separate monitoring setup for workflows. This also means traces can be correlated and displayed in the same interface alongside spans from application code, Kubernetes, and databases, thereby answering cross-system questions such as whether "workflow slowness" originates from external systems or its own nodes.
Practical Value for Enterprises
The most immediate benefit is faster incident diagnosis. Teams can use traces to view the complete call path and then narrow down the investigation to the node that failed or performed poorly. This capability is especially useful in scenarios involving multiple systems, each with its own monitoring data.
The second benefit is more targeted performance optimization. End-to-end traces allow teams to see where execution time accumulates, rather than assuming upfront that n8n itself is the source of latency. If external service calls are the slowest part of the workflow, traces should clearly show this relationship in the chosen backend.
For smaller teams, being able to reuse existing OTLP-compatible backends may lower the barrier to introducing workflow observability. However, the actual value depends on whether the enterprise already runs compatible tools and how critical its workflows are. The official announcement focuses on tracing capabilities and configuration, and does not separately list pricing terms for this feature.
Span attributes are the mechanism in OpenTelemetry for attaching structured key-value pairs to spans, such as project.id, workflow.name, or node.type. They do not change the tracing chain itself, but provide dimensions for filtering, grouping, and aggregation in the backend. n8n supports defining custom attributes at the project, workflow, and node levels, effectively allowing teams to tag each execution with business semantics.
In practice, this means operations personnel can filter traces by a specific project, a critical workflow, or a particular node in Datadog or Grafana, quickly isolating the target interval without having to sift through massive execution records one by one. For teams running dozens or hundreds of automation processes simultaneously, attribute dimensions are the key to moving traces from "viewable" to "queryable," and are also a core factor determining whether observability investments can truly translate into troubleshooting efficiency.
Frequently Asked Questions
What is n8n's OpenTelemetry capability? n8n can emit an OpenTelemetry trace for each workflow execution, with optional child spans for individual nodes. Traces display execution paths, durations, and statuses in compatible observability backends.
Which backends can receive n8n traces? Any OTLP-compatible collector and backend, with officially listed ones including Jaeger, Tempo, Datadog, Honeycomb, New Relic, and Grafana Cloud.
How to enable it? Configure via Settings > OpenTelemetry, supporting custom span attributes at the project, workflow, and node levels.
Can tracing identify failed nodes? Yes. With node-level child spans enabled, teams can inspect each workflow step to locate slow or failing nodes. This capability applies to both self-hosted and cloud deployments.
One-line Summary
n8n launches native OpenTelemetry tracing, generating a root span per workflow execution and optional node child spans to accelerate incident diagnosis and performance optimization.
Paragraph Summary
On June 8, n8n released native OpenTelemetry tracing capabilities, enabling teams to fully trace every downstream action of each workflow execution starting from the trigger. The feature generates a root span per run recording the end-to-end path, status, and duration, with optional child spans per node to identify exactly which step is slow or failing. Traces can be exported to any OTLP-compatible collector and backend, with officially listed ones including Jaeger, Tempo, Datadog, Honeycomb, New Relic, and Grafana Cloud. Configuration is at Settings > OpenTelemetry, supporting custom span attributes at the project, workflow, and node levels. The core value lies in faster incident diagnosis and more targeted performance optimization, while allowing enterprises with existing OTLP observability systems to directly reuse their current environment.
Related articles

Felix Rieseberg Personal Homepage
Felix Rieseberg's personal homepage sparks attention on Hacker News. This article covers the Slack engineer's technical background, the rise and fall of nativefier, and the value of a developer homepage as a tech calling card.

@ai-sdk/vue 3.0.306 Patch Release Syncs with [email protected] Update
@ai-sdk/vue 3.0.306 released, synced with [email protected]. A routine patch release for the Vercel AI SDK ecosystem with no public API changes; the Vue adapter layer stays version-aligned with the core package.

Gemini 4 Argon API Launches: The Era of Million-Token Output Begins
Google launches Gemini 4 Argon with sparse MoE architecture, up to 1M output tokens, and a 68.90% Vals Index score, available across API, AI Studio, and the Gemini app.