New AI Chart Interaction: Continuous Follow-up Questions and Visualization in Conversation

AI assistants continuously ask follow-up questions and generate new charts in conversation, making exploratory analysis smoother.
The article introduces an emerging AI chart interaction method: users no longer need to reconfigure parameters for each follow-up question. Instead, they can use the /visualize command in the same chat window to directly generate new charts based on conversation context. This evolution from single generation to continuous conversation lowers the barrier to exploratory analysis, allowing non-technical users to quickly gain insights through natural language. At the same time, all charts remain in the same chat history, forming a traceable analysis document. However, this feature is still in its early stages, with limitations such as context understanding accuracy and performance on large-scale data. Future directions may include intelligent chart recommendations, automatic anomaly detection, and direct database integration.
In the daily work of data analysis, a single chart is often just the starting point. After seeing a trend chart, we immediately want to ask "what if we break it down by region?" or "is this growth correlated with another metric?" Traditional tools require us to switch interfaces and reconfigure parameters, but directly asking follow-up questions and generating new charts within the same conversation is becoming a new capability of AI assistants.
From Single Generation to Continuous Conversation: The Evolution of Chart Interaction
In the past, using AI to generate charts was usually a one-off process: input data, describe requirements, get a chart. If you wanted to adjust dimensions or explore further, you had to start a new round of prompting. This pattern fragmented the analytical thought process, making "follow-up questions" expensive.
Recently, a developer showcased a new interaction method on social media: after AI generates the first chart, users can directly ask follow-up questions in the same chat window and use the /visualize command to have AI generate another chart based on the new question. The entire process requires no leaving the conversation, allowing the analytical chain to continue naturally.
This change may seem minor, but it touches the core pain point of data analysis—exploratory analysis requires rapid iteration. Every follow-up question should be low-cost, rather than requiring a form to be filled out again.
The /visualize Command: How Does It Work?
According to the showcased snippet, /visualize is a trigger command. After the user inputs it, the AI understands the data and questions in the current conversation context and outputs a new chart. It may combine natural language processing with a chart generation engine, automatically selecting the appropriate chart type.
For example, if the first chart shows monthly sales trends, and the user then asks "which product line contributes the most?" and inputs /visualize, the AI will generate a bar chart or pie chart broken down by product line. The key is that the AI needs to remember the previous data and conversation history, rather than asking again.
The specific implementation details of this feature have not been fully disclosed yet, but from the interaction logic, it emphasizes the continuity of conversation. For analysts, product managers, or students who frequently work with data, this seamless experience can significantly shorten the path from question to insight.
Why Continuous Visualization Is Worth Attention
Although traditional BI tools and spreadsheets are powerful, they have steep learning curves and are difficult to use for rapid exploration with natural language. Conversational analysis driven by large language models lowers the barrier, allowing non-technical users to obtain charts simply by asking questions.
The ability to ask continuous follow-up questions further amplifies this advantage. It simulates the human thought process: see a result, form a new question, verify immediately. This "conversation as analysis" model may change the way we interact with data.
Moreover, since all charts remain in the same chat history, the analysis process naturally forms a traceable document. When reviewing, you can clearly see how each conclusion was derived step by step, facilitating team collaboration and reporting.
Exploratory Data Analysis (EDA) is a core methodology in statistics and data science, systematically proposed by John Tukey in his 1977 book of the same name. It emphasizes letting the data "speak" before forming hypotheses, rather than proposing hypotheses first and then verifying them. It relies on frequent visualization and statistical summaries, discovering anomalies, correlations, and potential structures by continuously changing grouping dimensions and filter conditions. Traditional EDA tools (such as R's ggplot2 and Python's pandas-profiling) are powerful, but each transformation requires rewriting code or dragging fields, resulting in high cognitive load. Continuous conversational visualization compresses the "question—chart—question again" loop to minimum friction, thus aligning more closely with the essential rhythm of EDA.
Current Limitations and Future Possibilities
Such features may still be in an early stage. They depend on the AI's accuracy in understanding context. If the data is complex or the question is ambiguous, the generated charts may deviate from expectations. In addition, performance and accuracy when handling large-scale datasets are also challenges.
However, the direction is clear: AI assistants are shifting from "answering a single question" to "supporting an exploration session." In the future, we may see smarter chart recommendations, automatic anomaly detection, and even direct integration with databases.
For content creators and developers, paying attention to such interaction innovations can help us better leverage AI tools to improve efficiency. If you haven't yet tried continuously generating charts in a conversation, start with a simple dataset and experience this smooth analytical rhythm.
Context window is the total amount of tokens a large language model can "remember" at one time, usually measured in thousands or millions. When generating charts conversationally, the model must keep previous data summaries, user questions, and descriptions of generated charts within the window to correctly understand what "this growth" or "break down by region" refers to. When the data volume is large or there are many conversation turns, the context will overflow, causing the model to forget early information or generate incorrect charts. Mitigation methods include retrieval-augmented generation (RAG), conversation summary compression, and external state storage, but these all increase latency and engineering complexity. Therefore, the reliability of continuous visualization in real business scenarios largely depends on context management strategies rather than model capability alone.
One-line Summary
AI assistants continuously ask follow-up questions and generate new charts in conversation, making exploratory analysis smoother.
Paragraph Summary
The article introduces an emerging AI chart interaction method: users no longer need to reconfigure parameters for each follow-up question. Instead, they can use the /visualize command in the same chat window to directly generate new charts based on conversation context. This evolution from single generation to continuous conversation lowers the barrier to exploratory analysis, allowing non-technical users to quickly gain insights through natural language. At the same time, all charts remain in the same chat history, forming a traceable analysis document. However, this feature is still in its early stages, with limitations such as context understanding accuracy and performance on large-scale data. Future directions may include intelligent chart recommendations, automatic anomaly detection, and direct database integration.
Related articles
ChatGPT Space Launches: Team Collaboration and New Pages Features Explained
ChatGPT Space is OpenAI's new team collaboration feature with Pages, real-time collaboration, and Slack/Google Drive sync. We break down its privacy design, multi-platform integration, and the full workflow from conversation to document.

Migrating Apache Spark UDFs to GPU Acceleration with AI Agents
NVIDIA developer blog explains how AI Agents rewrite Apache Spark UDFs for GPU acceleration, covering migration criteria, agent rewriting and verification workflows, plus pitfalls like result consistency and CPU-GPU transfer overhead.
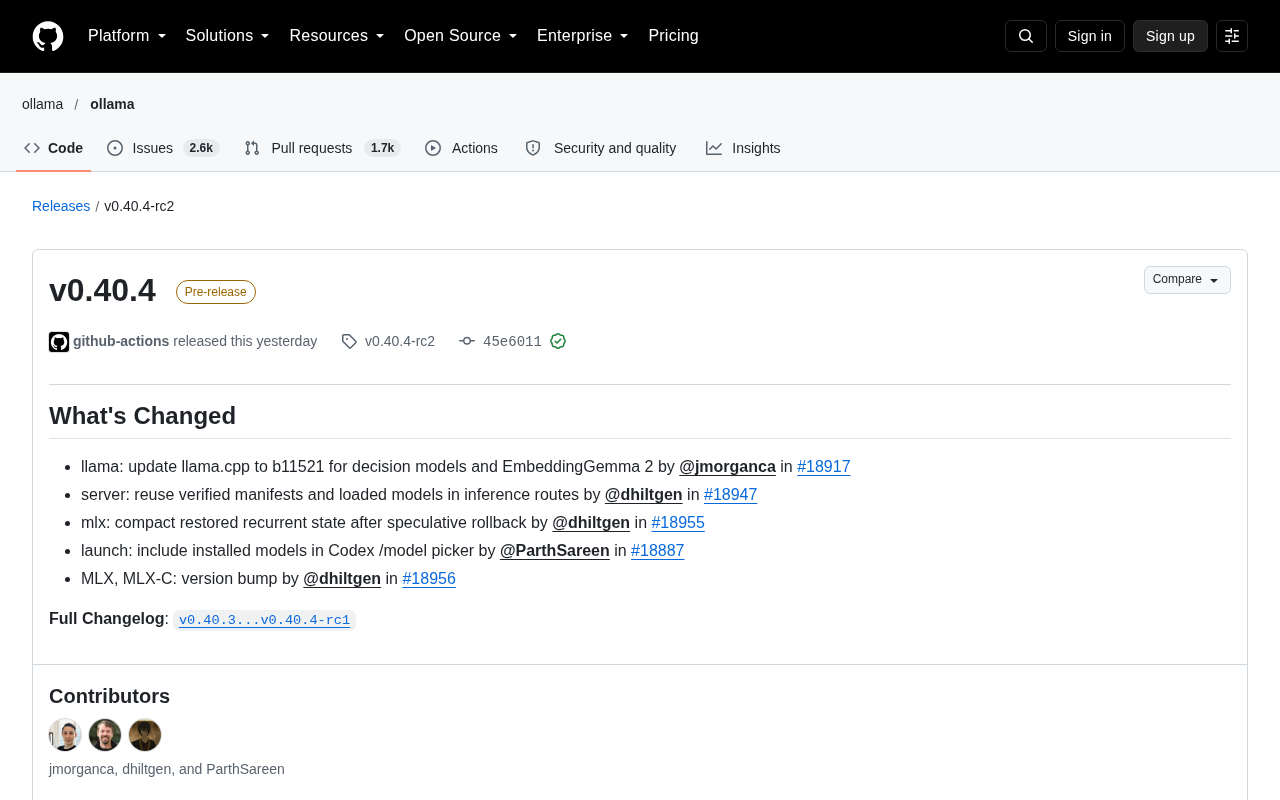
Zed Editor v0.40.4-rc2 Released: Usage Credits Now Available Without Upgrading
Zed editor releases v0.40.4-rc2, allowing users to use usage credits for AI features without upgrading to a paid plan, lowering the trial barrier.