New VS Code Extension: Visualize and Debug Your LangGraph Agent Workflows

A VS Code extension that visualizes LangGraph/CrewAI agents as interactive graphs with real execution replay and two-way code editing.
Agentic Engineering Extension is a VS Code plugin designed for developers building AI agents with LangGraph, CrewAI, and similar frameworks. It renders agent codebases as interactive node graphs, with each node directly bound to its source location for one-click navigation. Unlike pure visualization tools, it runs your actual compiled graph and supports replay from any intermediate node — drastically reducing the time and API cost of debugging long-chain agents. Edits made in the visual interface write back directly to Python source files, keeping graph and code in permanent sync. A built-in evaluation engine supports regression detection against test datasets, and 10 Copilot-powered commands surface issues like unused tools and missing error handling, all with precise file:line references. The extension is free and compatible with Cursor, Windsurf, and other VS Code-based AI editors.
When building AI agents, the hardest part is often not writing the logic — it's tracking the control flow. When you're building complex agents with LangGraph or CrewAI, node transitions, tool calls, and state passing are scattered across multiple source files. Reconstructing the execution path by reading code manually is both inefficient and error-prone. A VS Code extension called Agentic Engineering Extension recently caught attention on Reddit for tackling exactly this pain point with an interactive, graph-based approach.
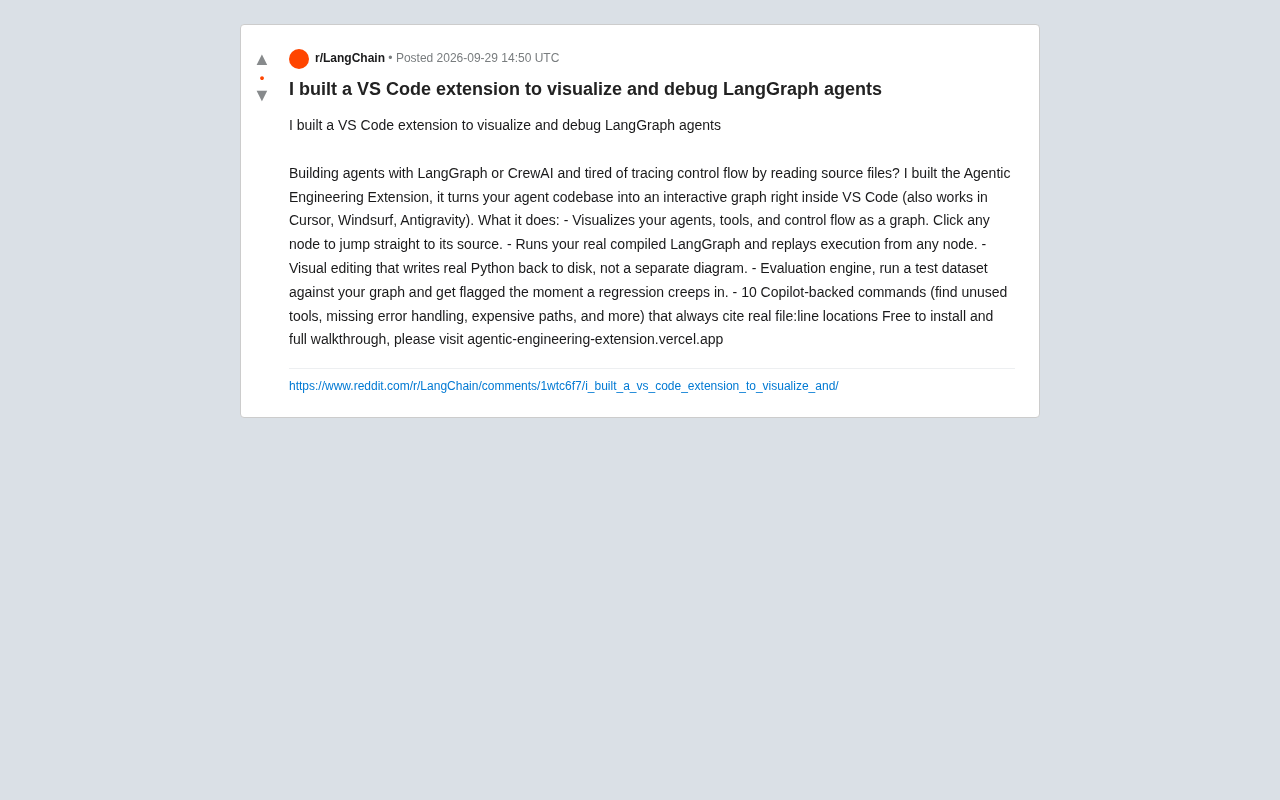
Turning Your Agent Codebase into an Interactive Graph
The core idea behind this extension is simple: instead of requiring developers to dig through source files to understand an agent's structure, it renders the entire agent codebase as an interactive graph directly inside VS Code. Your agents, tools, and the control flow between them are all represented as nodes and edges.
What makes this especially practical is that every node in the graph is bound to the actual source code — clicking any node jumps you directly to the corresponding code location. This means the visualization isn't an abstract layer detached from your code; it stays in sync with the real implementation at all times. For complex agent projects with dozens of nodes, this "what you see is code" navigation style significantly reduces cognitive overhead.
It's worth noting that beyond native VS Code, the extension also works with Cursor, Windsurf, Antigravity, and other AI editors built on the VS Code engine — covering the most popular AI-assisted development environments today.
LangGraph is a framework from the LangChain team for building stateful, multi-actor AI applications. Its core abstraction models agent execution logic as a directed graph (DAG or cyclic): nodes represent processing steps or tool calls, edges represent control flow, and data is passed between nodes via a shared state object. CrewAI is another popular multi-agent collaboration framework focused on organizing agents with different "roles" into teams and assigning tasks. Both frameworks share the same debugging challenge: as the graph topology grows more complex and node counts increase, it becomes very difficult to mentally reconstruct the full execution path from Python code alone — let alone pinpoint which node produced incorrect output during a specific run.
Real Execution Replay and Bidirectional Editing
Many visualization tools stop at "drawing diagrams," but this extension emphasizes actually running your real compiled LangGraph. It executes your actual compiled graph and supports replay execution from any node. The ability to replay from an intermediate node is especially valuable when debugging long-chain, multi-branch agents — you don't need to re-run the entire workflow from scratch every time just to isolate a problem at a specific step.
Another standout feature is visual editing. Changes made in the graphical interface are written directly back to the real Python code on disk, rather than generating a separate diagram that drifts out of sync with your code. This solves the classic problem with traditional architecture diagrams — the "draw it once, obsolete forever" trap. The graph and the code are always two views of the same data.
The ability to "replay from any node" is critical because LLM calls introduce latency and typically incur per-token costs. In an agent chain with a dozen nodes, being forced to re-run the full workflow from the start on every debugging iteration is both time-consuming and expensive. Being able to "pause and re-enter" at an intermediate node — rerunning only the subgraph you care about — is the key mechanism that compresses debugging time from minutes to seconds. In traditional software debugging, this maps to concepts like "time-travel debugging" or "hot reload," but in LLM agent contexts, implementation is significantly harder due to the non-deterministic nature of state.
Evaluation Engine and Copilot-Powered Analysis Commands
Beyond visualization and debugging, the extension includes a built-in evaluation engine. You can provide a test dataset, run evaluations against the full graph, and get immediate flagging whenever a regression is detected. For production-grade agents that undergo continuous iteration, this kind of automated regression detection is an essential quality safeguard.
The extension also provides 10 Copilot-powered commands covering common code review scenarios:
- Find unused tools
- Detect missing error handling
- Identify expensive execution paths
A key design principle for these commands: results always reference real file:line locations. Every suggestion is pinpointed to a specific file and line number, avoiding the common AI analysis pitfall of giving advice that sounds compelling but can't be traced back to anything concrete.
Agent "regression detection" is fundamentally different from traditional software testing. Conventional unit tests produce deterministic outputs, while LLM outputs are stochastic — the same input can produce different results across runs. Agent evaluation therefore typically relies on semantic similarity comparison, LLM-as-judge (using another model to assess output quality), or predefined scoring rubrics, rather than simple string matching. The value of the built-in evaluation engine lies in standardizing and integrating this process into the development environment, so developers can quickly quantify whether changes to prompts or graph structure have negatively impacted overall performance.
What This Means for Agent Development Workflows
As agent orchestration frameworks like LangGraph and CrewAI become mainstream choices for building complex AI applications, the surrounding developer tooling has lagged behind. Most developers are still relying on logging, reading source code, and drawing diagrams by hand to understand and debug their agents.
The value of Agentic Engineering Extension lies in integrating visualization, real execution, bidirectional editing, evaluation, and code review into a single development environment. None of these capabilities are individually groundbreaking, but bringing them together inside VS Code — fully synchronized with real source code at all times — forms a reasonably complete agent engineering workflow.
The extension is currently free to install, and the author has provided a full walkthrough demo. Interested developers can visit agentic-engineering-extension.vercel.app to learn more.
Summary
For teams building agents with LangGraph or CrewAI, tools like this reflect a broader trend: agent development is evolving from "writing scripts" toward genuine software engineering. Visual control flow, replayable debugging, and automated evaluation are becoming table-stakes requirements for agent development. That said, as a community-released tool, its stability and real-world performance on large-scale projects still awaits validation from a wider user base.
Related articles

Behind TinyFish's Free Search: The Real Cost of AI Agents Reading the Web
TinyFish opens search retrieval for free, but the real cost of AI Agents reading the web hasn't disappeared: with retrieval fees at zero, token processing and inference generation become the main expenses. This article breaks down both cost structures and analyzes the impact of free search on Agent infrastructure competition and developer cost strategy.

ScopeGuard: A Local-First Open Source AI Tool That Takes Aim at Freelancer Scope Creep
ScopeGuard is a local-first open source AI tool that helps freelancers detect client scope creep, cite contract clauses, and generate boundary-setting replies and change order quotations—all running locally to protect NDA privacy.

Philadelphia Woman Arrested for Blocking Delivery Robot: A Flashpoint in Human-Machine Conflict
A Philadelphia woman, Carolyn Marvin, was arrested for blocking an Uber delivery robot to protest job displacement, highlighting human-machine conflict and legal-ethical dilemmas.