Norcross Maine Forest Fire Maps: A Century-Old Cartographic Legacy and Data Visualization Pioneer

Norcross's 1918–1922 Maine fire maps bridge hand-drawn cartography with modern data visualization.
Archie G. Norcross's hand-drawn Maine forest fire maps (1918–1922) represent a remarkable early example of data visualization and disaster management cartography. Created before GIS or satellite technology, these maps aggregated fragmented fire reports into coherent spatial records. Today, they serve as invaluable baseline data for climate change research, historical GIS analysis, and training modern AI fire monitoring systems.
A Forgotten Masterpiece of Hand-Drawn Cartography
In an era dominated by digital Geographic Information Systems (GIS) and satellite remote sensing, it's hard to imagine how people documented and managed large-scale natural disasters like forest fires a century ago. GIS is a computer system designed to capture, store, analyze, and visualize geospatial data. The concept originated from the work of Canadian geographer Roger Tomlinson in the 1960s and has since been widely adopted in urban planning, environmental monitoring, disaster management, and beyond. Satellite remote sensing, on the other hand, acquires surface information through sensors mounted on artificial satellites. Since the United States launched the first Landsat satellite in 1972, humanity's ability to observe the Earth's surface has undergone a quantum leap. The combination of these two technologies has made large-scale environmental monitoring possible—but long before they existed, humans had already developed remarkably sophisticated traditions of manual cartography. The Maine forest fire maps drawn by Archie G. Norcross between 1918 and 1922 are exactly this kind of precious historical document—both a work of cartographic art and a practical example of early disaster data visualization.
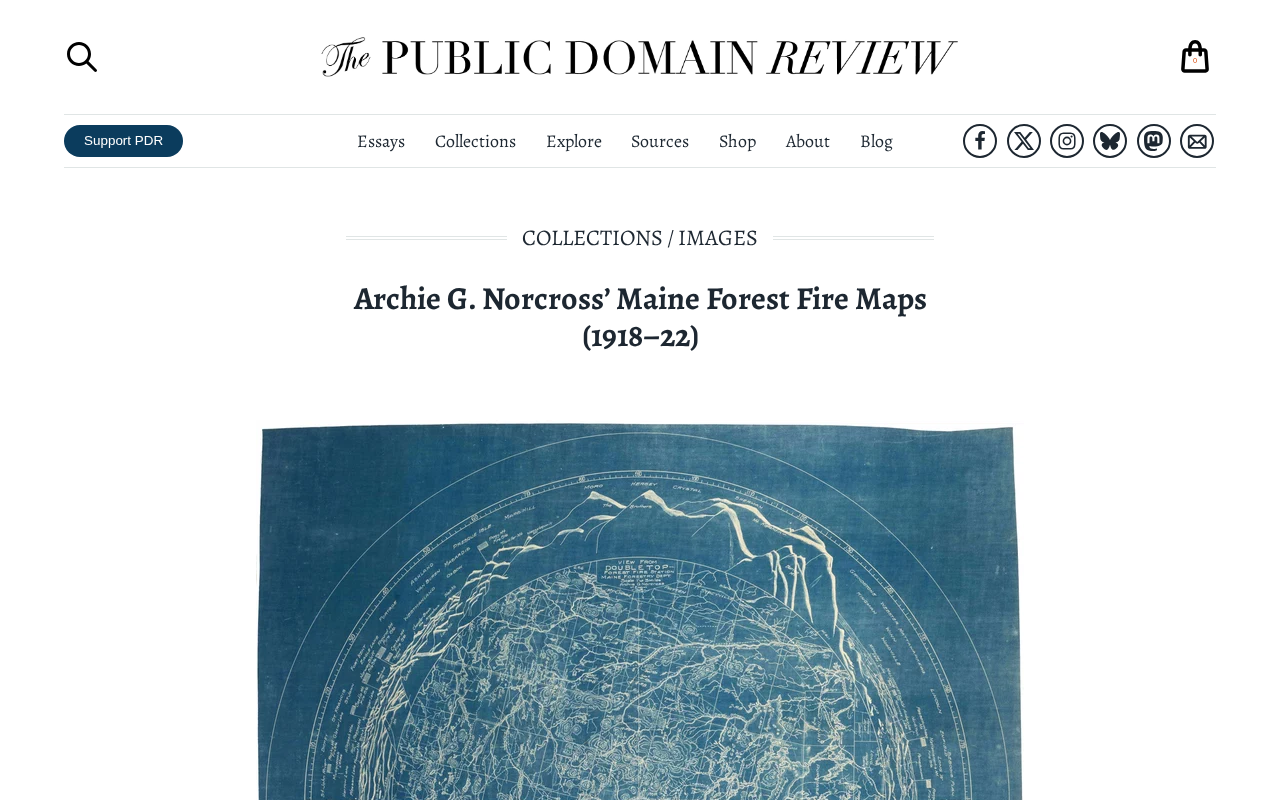
These maps meticulously recorded the distribution of forest fires across Maine during those years. Notably, Maine between 1918 and 1922 was in the midst of a critical transition in American forestry management. The "Big Blowup" of 1910 in the American West burned over 3 million acres of forest in Idaho and Montana, directly catalyzing systematic fire prevention policies at both federal and state levels. As the largest forestry state in the northeastern United States, with over 80% forest coverage and a timber industry that served as an economic pillar, Maine had an especially urgent need for fire documentation and management. Norcross's cartographic work was carried out precisely against the backdrop of this emerging institutional approach to fire management. In an era without GPS or real-time monitoring systems, cartographers had to rely on ground surveys, eyewitness reports, and local forestry records to manually plot fire extents and locations on maps. This work demanded extraordinary patience and precision, reflecting the rigorous approach to natural disaster management of the time.
Data Visualization in the Age of Hand-Drawn Maps
Viewed through the lens of modern data science, Norcross's maps were essentially a form of data visualization. He aggregated scattered fire events—occurrence times, burned areas, geographic coordinates—onto a unified map, enabling viewers to grasp the spatiotemporal distribution of fires at a glance.
The Core Challenge of Information Aggregation
In an era lacking standardized data collection processes, the greatest challenge facing cartographers was the fragmentation of information. Data for each fire event might come from different sources, follow different recording standards, or even contain contradictions. Integrating this heterogeneous data into a coherent, trustworthy map required the cartographer to possess strong judgment and synthesis skills.
This challenge bears a striking resemblance to modern data engineering. In contemporary data engineering, heterogeneous data refers to datasets that differ in source, format, and standards. The ETL (Extract-Transform-Load) pipeline is the standard methodology specifically designed to address heterogeneous data integration. Data engineers extract raw data from multiple sources, clean, transform, and standardize it, then load it into a unified data warehouse for analysis. The core problem Norcross faced a century ago—distilling consistent spatial information from fire reports of varying sources and formats—was essentially a manual ETL process. Whether it's hand-drawn cartography from a hundred years ago or today's big data analytics, the underlying logic remains the same: extracting meaningful signals from messy raw information and presenting them intuitively to decision-makers.
From Maps to Forestry and Disaster Prevention Decisions
The value of these fire maps extended beyond historical documentation—they also supported forestry management and disaster prevention decisions. By observing high-frequency fire zones and spread patterns, managers could allocate firefighting resources more effectively, plan firebreaks, and identify high-risk areas requiring priority monitoring. This was an early prototype of data-driven decision-making.
The Contemporary Research Value of Historical Fire Maps
For today's researchers, Norcross's fire maps hold multifaceted academic and practical value.
Baseline Data for Climate and Ecological Change
These maps serve as extremely valuable historical baseline data. By comparing fire distributions from a century ago with those of today, scientists can study the long-term impacts of climate change, forest management policies, and land use patterns on fire behavior. As global warming makes forest fires increasingly frequent, this kind of historical data becomes particularly critical. In recent years, fire seasons in the western United States and Canada have visibly lengthened, and fire intensity continues to climb. Having spatially documented fire records that extend back a full century is essential for distinguishing natural fire cycles from human-induced climate effects.
Raw Material for Digital Humanities and Historical GIS
Digitizing these hand-drawn maps, performing georeferencing, and overlaying them with modern geographic data can reveal patterns that modern data alone could never uncover. Georeferencing is the technical process of aligning non-GIS-native image materials—such as historical maps and aerial photographs—with known coordinate systems. Specifically, researchers identify several "control points" on historical maps—landmarks that can be precisely located on modern maps (such as river confluences, mountain peaks, or town locations)—and then use mathematical methods like affine transformation, polynomial transformation, or thin-plate spline transformation to "stretch" and "warp" the historical map to match modern coordinate systems. For hand-drawn maps, this process is particularly challenging due to the inevitable geometric errors in the original drafting—but once completed, it brings century-old spatial information into modern analytical frameworks. This also breathes new life into Norcross's work within the field of digital humanities research.
From Analog to Digital: Lessons from the Evolution of Fire Monitoring
The Tools Change, but the Methodology Endures
From Norcross's pen and paper to today's satellites, drones, and machine learning models, the tools for forest fire monitoring have undergone revolutionary changes. But the underlying methodology—collecting data, integrating information, visualizing results, and supporting decisions—has remained fundamentally consistent. The significance of technological progress lies in improving efficiency and precision, not in changing the essential structure of the problem.
Insights for Modern AI Fire Monitoring
Today, an increasing number of AI systems are being deployed for forest fire prediction and monitoring. This field encompasses three major technical directions: first, computer vision-based fire detection, using models like convolutional neural networks (CNNs) to automatically identify thermal anomalies from satellite imagery (such as data from NASA's MODIS and VIIRS sensors); second, time-series analysis-based fire risk prediction, combining meteorological data (temperature, humidity, wind speed), vegetation dryness indices, and historical fire records with models like random forests, gradient boosting trees, or LSTMs to forecast future fire probability; and third, fire spread simulation, using physics-based models combined with machine learning to predict fire trajectories and assist in firefighting resource deployment. Tech companies like Google and Microsoft, as well as the National Interagency Fire Center (NIFC), are actively deploying such systems.
However, the reliability of these advanced systems depends heavily on high-quality historical training data. The performance ceiling of machine learning models is determined by the quality and coverage of training data—if historical data only spans the past few decades, models struggle to capture fire patterns at longer time scales. Historical records like those created by Norcross constitute a critical piece for understanding long-term trends, extending the temporal window of training data back nearly a century.
As we marvel at the powerful capabilities of modern AI, we should not forget: it was countless pioneers like Norcross who, through painstaking manual effort, built the foundation upon which today's data science operates.
Conclusion: A Technological Legacy Spanning a Century
Archie G. Norcross's Maine forest fire maps represent a cartographic and data management legacy that spans a hundred years. They show us that the core ideas behind data visualization, disaster management, and information integration had already taken root long before the digital age. While pursuing cutting-edge technology, looking back at these simple yet solid historical practices may offer us deeper insight into the true nature of technological evolution.
Related articles

Workbuddy for Absolute Beginners: How a Desktop AI Agent Fits Into Real Workflows
A beginner's guide to the Workbuddy desktop AI agent: installation, claiming credits, file management, and building automated workflows—compared with CodeX for fit and cost, helping professionals shift from AI question-askers to AI managers.

OpenAI's New Agent Stack: Computer Use, Decisions API, and Ultra-Fast Workflows
OpenAI Dev Day unveiled a new agent stack: Computer Use outperforms humans, Decisions API delivers ultra-low-latency classification via Luna, Agents API opens the same Computer Use capabilities, and GPT-6.1 Sol costs only one-seventh of Astra. Core updates, benchmark data, and developer insights.

Liang Wenfeng Open-Sources DeepInfo Inference Framework, Takes On U.S. Ban
DeepSeek open-sources its DeepInfo inference framework after its models, featuring GPU/CPU cross-pipelining, small-model prediction with large-model verification, and full Huawei Ascend and NVIDIA chip support—facing the U.S. federal ban head-on. This article analyzes its significance for AI deployment and open-source strategy.