One "Benchmark Chart" Breaks Reddit: The Absurd Truth Behind AI Benchmarking

A fake AI benchmark chart using version numbers as metrics went viral — and exposed how few people read axes.
A chart disguised as an "OpenAI internal benchmark" went viral on Reddit, with a punchline hiding in plain sight: the "performance metric" on the Y-axis was literally just the model version number. The comment section reaction was the real story — some got the joke instantly, while others launched into serious debate without ever glancing at the axes, becoming a live case study in the "react first, understand later" disease of the information age. The stunt also landed a pointed critique of AI industry benchmaxxing, where truncated axes and cherry-picked data routinely package marginal gains as "crushing leads."
A Carefully Designed "Bait" Experiment
A chart claiming to be an "OpenAI internal benchmark" recently went viral on Reddit, with a headline gravely announcing that "GPT-6.1 Sol crushes Opus 5.5, Anthropic struggling to keep up." It sounded like a bombshell industry leak — but the truth split the comment section in two: those who got it were laughing, and those who didn't were arguing.
The genius of the chart lies in its Y-axis: the so-called performance metric is literally just the model version number itself. That's right — 6.1 is indeed a larger number than 5.5, and that's the entire joke. The whole "benchmark" is one big circular argument — using version numbers to "prove" that the model with the higher version number is more capable.
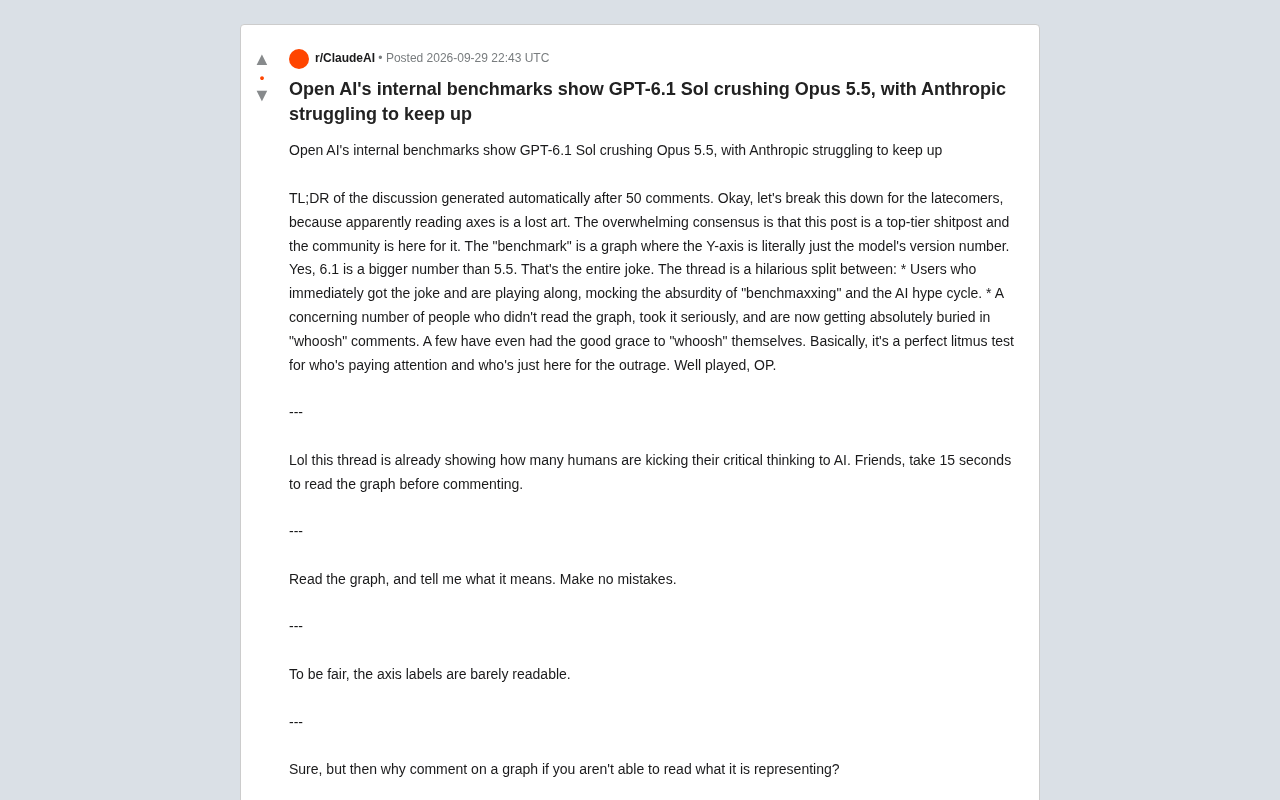
With the simplest possible setup, the poster created a brilliant piece of satire about "AI benchmarking culture." But the real spectacle wasn't the chart itself — it was how people reacted in the comments.
The Comment Section: A Mirror for Attention Spans
According to the auto-generated discussion summary after 50 comments, the community's prevailing consensus was: this is a "world-class bait post," and people loved every second of it. The discussion unfolded as a dramatic split:
Some users instantly got the joke and played along, mocking the current culture of "benchmaxxing" (chasing flashy benchmark scores) and the absurdity of the entire AI hype cycle. Meanwhile, a surprisingly large number of users never actually looked at the axis labels, took the chart at face value, and launched into serious debate — only to be buried in "whoosh" replies. A few, to their credit, self-replied with a sheepish "whoosh" once they caught on.
As one highly upvoted comment put it: "This post perfectly measured who's actually thinking and who's just here to vent." Another user was even more direct: "This post has exposed how many people have outsourced their critical thinking to AI. Friends, please spend 15 seconds looking at the chart before you comment."
The Real Problem Behind "Can't Read the Axes"
Interestingly, some commenters stepped up to defend the people who got fooled. One noted that "the axis labels are genuinely almost illegible," trying to give the confused a pass. But someone fired back immediately: "If you can't read what the chart is actually saying, why are you commenting on it?"
This exchange hit on a universal phenomenon of the information age — people increasingly tend to take a stance first, understand later, or skip understanding entirely and go straight to emotional output. One commenter nailed it with a sardonic quip: "Because outrage works without thinking."
One technically-minded user also earnestly pointed out: "This axis doesn't start at zero — that's suspicious." — which was both a knowing joke and an inadvertent pointer to a real trap in data visualization: truncated axes that exaggerate differences are a go-to trick in marketing charts designed to mislead audiences.
A truncated axis is one of the most commonly abused techniques in data visualization. Normally, the Y-axis of a bar or line chart should start at zero, giving readers an accurate sense of absolute magnitude. When the axis baseline is raised to a non-zero value, even tiny differences get visually amplified several times over, creating the false impression of a "crushing lead." For example, if two models score 91.2% and 91.8% respectively — a gap of just 0.6 percentage points — but the Y-axis starts at 91%, the taller bar appears nearly double the height of the shorter one. This technique shows up regularly in business charts, media reporting, and even government statistics, which is why data literacy education almost universally lists "check the Y-axis origin" as the first step in reading any chart. The user who earnestly flagged the non-zero axis was playing along with the joke, but inadvertently offered genuinely useful advice.
From Joke to Industry Anxiety: The Reality of "Benchmaxxing"
The reason this chart resonated so widely is that it struck at a genuine pain point in today's AI industry. Nearly every major model launch comes packaged with a stack of benchmark comparison charts, using a few percentage points of lead to proclaim "dominance" over competitors. Every new iteration of GPT, Claude (including the Opus series), and others arrives with heavy benchmark-driven marketing.
When "benchmaxxing" becomes standard practice, the credibility of benchmarks themselves gets diluted. Companies may optimize specifically for test sets, selectively highlight favorable data, or use truncated axes to inflate marginal advantages. This satirical "version-number-as-performance" chart is, at its core, a sharp critique of exactly that: if all benchmark results can be gamed, how is using a version number to "prove" superiority any different from a carefully curated benchmark graphic?
Benchmaxxing refers to the practice of AI companies optimizing their models specifically to achieve impressive scores on particular benchmarks — and sometimes more broadly to the marketing strategy of selectively showcasing only the most favorable test results. The root of the problem: benchmarks were originally developed by academics as objective tools for horizontally comparing model capabilities, but once they became the arena for commercial competition, the incentive structure warped. "Performing well on the test" and "actually being capable" started to decouple. Common tactics include mixing training data with content similar to test sets (test set contamination), cherry-picking subtasks where a given model looks best, or simply never publishing scores on benchmarks where performance is weak. Widely cited benchmarks like MMLU, HumanEval, and GSM8K have all faced similar criticisms at various points. This is precisely why the industry has been pushing harder toward "blind evaluation" and real user preference studies as replacements for single standardized benchmark scores.
A Harmless Stunt With a Serious Lesson
The post ultimately revealed no real technical intelligence, and both GPT-6.1 and Opus 5.5 are entirely fictional. But as a community experiment, it was remarkably effective — at minimal cost, it tested whether people are willing to pause and think independently for 15 seconds when confronted with "seemingly authoritative" information.
In an era when AI can generate vast quantities of convincing-looking content, that kind of reminder is more valuable than ever. The real "benchmark" perhaps shouldn't only apply to models — it should apply to each of our own attention spans and judgment. Next time you see a performance chart claiming to "crush the competition," it might be worth asking one simple question first: what does this axis actually represent?
Related articles

JobRunner MCP Server: AI Agents Can Now Fix Failed Java Jobs
JobRunner launches an open-source MCP server enabling AI agents to view cluster status, diagnose failures, and recover Java jobs—incident response from any cloud coding environment or existing agent.

MLAI Digital Launches 9 Security Agents: MCP Server Safeguards the Full Lifecycle of Agentic AI
MLAI Digital launches Security MCP Server with nine built-in specialized security agents covering vulnerability discovery, attack simulation, prompt injection detection, API and infrastructure assessment, and accelerated remediation—embedding security validation across the full Agentic AI lifecycle from development to production.

Running Isaac Lab on H100 GPUs: Exploring Better Approaches
Exploring optimization methods for running Isaac Lab on NVIDIA H100 GPUs, including MIG configuration, mixed precision, TensorRT acceleration, and community experience to improve robotics simulation and reinforcement learning efficiency.