Opik: An Open-Source LLM Observability Platform for Debugging, Evaluation, and Monitoring All in One Place

Opik is Comet ML's open-source observability platform for full-lifecycle LLM application management.
Opik is an open-source LLM application management tool by Comet ML, offering three core capabilities: end-to-end tracing, automated evaluation, and production monitoring. It supports deep debugging of RAG systems and Agent workflows, includes built-in evaluation frameworks for hallucination detection and relevance scoring, and provides production-grade dashboards for latency monitoring and token cost tracking. Built with Python and seamlessly integrating with LangChain, LlamaIndex, and other popular frameworks, it has earned over 19,000 GitHub Stars.
Project Overview
Opik is an open-source full-lifecycle management tool for LLM applications, developed by the Comet ML team. It's purpose-built to address the pain points of debugging, evaluation, and production monitoring for large language model applications. Comet ML is a company focused on machine learning experiment management and model productionization, with deep experience in the MLOps space and a track record of serving numerous enterprise clients. Opik can be seen as Comet ML's strategic move to extend its deep expertise in traditional ML observability into the emerging field of LLM applications. Whether you're building RAG systems, agentic workflows, or standard LLM applications, Opik delivers a complete observability solution from development to deployment.
As of now, the project has earned over 19,000 stars on GitHub with nearly 1,500 forks, reflecting a highly active community and underscoring developers' urgent need for LLM observability tools.
It's worth noting that LLM Observability is an emerging field that extends the traditional software engineering concept of observability. Traditional observability focuses on three pillars: logs, metrics, and distributed tracing. LLM observability, however, requires additional attention to LLM-specific dimensions such as semantic changes in prompts, uncertainty in model inference, token consumption patterns, and output quality drift. As large models like GPT-4 and Claude have been widely integrated into production systems, developers have discovered that traditional APM (Application Performance Monitoring) tools like Datadog and New Relic fail to effectively capture the core issues of LLM applications — for instance, a subtle change in prompt wording can cause a dramatic drop in output quality, something completely invisible in traditional monitoring metrics.
Core Features in Detail
End-to-End Tracing: Breaking Free from the LLM Application "Black Box"
One of the most frustrating problems in LLM application development is having no idea where to start debugging when model output doesn't meet expectations. Opik's tracing capability records the complete context of every LLM call — from input prompts and model parameters to intermediate steps and final output — all at a glance.
Specifically:
-
RAG System Tracing: Clearly shows which document chunks were returned during the retrieval phase, how re-ranking results turned out, and what the final assembled prompt sent to the model looks like. RAG (Retrieval-Augmented Generation) is one of the most popular LLM application architectures today, enhancing model response quality by retrieving relevant documents from external knowledge bases before generation. A typical RAG pipeline involves multiple stages: query rewriting, vector retrieval, document re-ranking, context window assembly, and final generation. Each stage can introduce problems — insufficient retrieval recall, re-ranking model misjudgments, or context truncation causing loss of critical information. Without fine-grained tracing, developers can only see that the final output is subpar but can't determine which stage is the root cause.
-
Agent Workflow Tracing: Fully visualizes every decision step of an Agent, including tool call chains and state transitions.
-
Multi-Level Call Visualization: Supports nested span structures, enabling layer-by-layer decomposition of even complex call chains. A Span is a core concept in distributed tracing, originating from Google's Dapper paper and the subsequent OpenTelemetry standard. A Span represents a time-bounded unit of operation, and nested Spans form a tree structure that reflects parent-child call relationships. In LLM applications, a top-level Span might represent a user request, with nested child Spans representing prompt template rendering, vector database queries, LLM API calls, post-processing, and other steps. This structured approach to tracing allows developers to precisely measure the latency and resource consumption of each stage, quickly pinpointing performance bottlenecks.
This fine-grained tracing capability means developers no longer have to stare helplessly at model outputs — they can pinpoint exactly which stage is causing the problem.
Automated Evaluation: Measuring LLM Output Quality at Scale
Manually evaluating LLM outputs is both time-consuming and difficult to scale — a common pain point for many teams. Opik includes a built-in automated evaluation framework covering several key dimensions:
-
Accuracy Assessment: Checks whether model outputs align with expected answers.
-
Hallucination Detection: Identifies whether the model has generated fabricated content that contradicts the provided context. LLM Hallucination refers to the model generating content that appears plausible but is actually inconsistent with facts or contradicts the provided context. Hallucination detection typically employs multiple techniques: using NLI (Natural Language Inference) models to determine entailment relationships between generated content and source documents, verifying factual consistency through cross-referencing, and leveraging another LLM as a judge (LLM-as-Judge) to assess output faithfulness. In RAG scenarios, hallucination detection is particularly critical because users expect the model's answers to be strictly grounded in retrieved documents rather than the model's own parametric knowledge.
-
Relevance Scoring: Quantitatively evaluates the match quality of RAG system retrieval results.
-
Custom Metrics: Flexibly define proprietary evaluation criteria based on business requirements.
With this evaluation mechanism, developers can quickly obtain quantitative feedback after each iteration instead of relying on "gut feeling" to judge optimization results, significantly shortening development cycles.
Production-Grade Monitoring Dashboard: Peace of Mind After Deployment
Continuous monitoring is essential for maintaining service quality once LLM applications are deployed to production. Opik provides an out-of-the-box monitoring dashboard that helps teams stay on top of application health in real time:
- Real-time monitoring of response latency and throughput
- Token consumption and cost tracking — In production operations of LLM applications, token consumption directly correlates with operational costs. Taking GPT-4 as an example, its API pricing charges separately for input and output tokens. A poorly designed prompt could waste thousands of tokens per call. For production systems processing hundreds of thousands of requests daily, token optimization can mean tens of thousands of dollars in monthly cost differences. Additionally, different models' context window limits (e.g., 4K, 8K, 128K tokens) require developers to precisely track token usage for each call to avoid truncation or errors caused by exceeding limits.
- Anomaly pattern detection and alert notifications
- Aggregated analysis and trend insights from user feedback
Technical Architecture and Ecosystem Integration
Opik is built with Python, making it a natural fit for the mainstream LLM application development stack. It supports seamless integration with popular frameworks like LangChain and LlamaIndex — just a few lines of code to get started, with minimal migration costs.
LangChain and LlamaIndex are the two most influential open-source frameworks in the LLM application development space today. LangChain provides a modular abstraction layer that helps developers quickly build LLM applications with complex logic including chain calls, Agents, and memory management. LlamaIndex focuses on data connectivity and index construction, excelling at transforming various data sources into LLM-consumable formats and serving as the go-to framework for building RAG systems. Opik's integration with both frameworks means developers don't need to significantly modify existing code — simply adding a few decorators or callback functions unlocks full observability capabilities.
From an ecosystem positioning perspective, Opik fills the observability gap for LLM applications from development to production. Unlike traditional APM tools, it deeply understands the unique requirements of LLM applications — prompt version management, token consumption tracking, and semantics-based quality evaluation — areas that generic monitoring tools simply don't cover.
Typical Use Cases
- LLM Application Development Teams: Quickly identify prompt engineering issues during development and reduce debugging time.
- RAG System Optimization: Continuously improve retrieval quality and generation results through tracing and evaluation data.
- Agent Developers: Debug complex multi-step Agent workflows and untangle decision logic.
- MLOps Teams: Monitor the health of LLM applications in production environments, detecting and addressing anomalies promptly.
Summary
As LLM applications transition from the experimental stage to large-scale production deployment, observability tools have evolved from a "nice-to-have" to a "must-have." Opik directly tackles the three core challenges developers face when building LLM applications — difficult debugging, lack of evaluation, and monitoring blind spots — delivering a comprehensive and practical solution.
The 19,000+ stars on GitHub validate the community's strong demand for this type of tool. If your team is building or maintaining LLM applications, Opik is an open-source option well worth serious consideration.
Key Takeaways
- Opik provides full-lifecycle management for LLM applications, covering three core capabilities: debugging, evaluation, and production monitoring.
- Comprehensive tracing supports deep debugging of RAG systems and agentic workflows.
- Built-in automated evaluation framework with multi-dimensional quality assessment including hallucination detection and relevance scoring.
- Production-grade dashboard with latency monitoring, cost tracking, and anomaly detection for operations.
- The project has earned 19,000+ GitHub Stars, is built with Python, and integrates seamlessly with mainstream LLM frameworks.
Related articles
 Product Reviews
The Programmer's Desk Setup Guide: Building a Workspace That Feels Like Home
Discover how programmers build productive, comfortable workspaces. From multi-monitor setups to ergonomic design, explore the desk philosophy that drives focus and flow.
 Product Reviews
Qoder vs Cursor Real-World Comparison: Which $20/Month AI IDE Is Better?
Hands-on comparison of Qoder vs Cursor AI IDEs: Agent autonomy, human interaction count, and architecture decisions. Qoder needed only 2 interactions vs Cursor's 8.
 Product Reviews
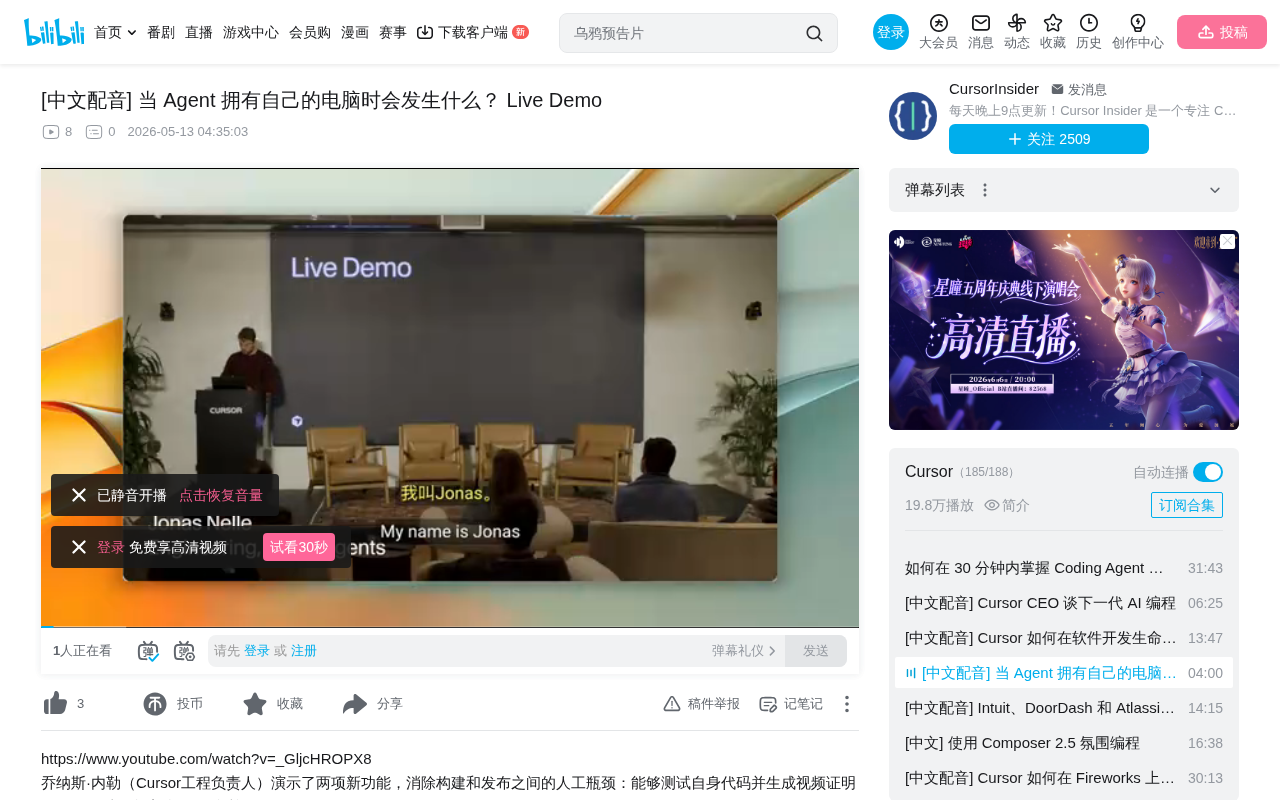
Cursor Cloud Agent Demo: Eliminating Bottlenecks Across the Entire Software Development Lifecycle
Deep analysis of Cursor's Cloud Agent demo showing how cloud VMs, automated test artifacts, and a full-chain control plane systematically eliminate human bottlenecks across the software development lifecycle.