OutageDeck: A Unified Monitoring Dashboard Aggregating Status from 172 Cloud Services

OutageDeck aggregates 172 cloud service status pages into one unified monitoring dashboard with AI Agent support.
OutageDeck is a unified monitoring dashboard that aggregates real-time status data from 172 cloud services and SaaS providers using official feeds. It offers alerts, incident history, a free JSON API, and a built-in MCP Server enabling AI Agents to query service outages via natural language. Paid plans allow integration of private status pages for complete observability across both external dependencies and internal services.
As Tech Stacks Grow More Complex, Why Outage Monitoring Has Become Essential
Modern software applications are no longer isolated monoliths—they're assembled from dozens or even hundreds of external services. Your application might simultaneously depend on AWS for compute resources, Stripe for payment processing, SendGrid for email services, Cloudflare for CDN, and OpenAI's API. A failure in any single link can bring your entire product to a halt.
This complexity isn't accidental. As modern software architecture has evolved from Monolithic Architecture to Microservices Architecture, the number of external dependencies has grown exponentially. In the monolithic era, a team might only need to monitor their own servers and databases; in the cloud-native era, a mid-sized SaaS product depends on an average of 15-30 external services. This "Composable Architecture" improves development efficiency and flexibility, but it also introduces the risk of Cascading Failure—when a critical upstream service goes down, the failure propagates down the dependency chain, impacting the availability of the entire product.
The problem is that every service provider has its own independent Status Page. When anomalies appear in production, engineers often find themselves switching between a dozen browser tabs, checking one upstream service after another to figure out which one is causing the issue. This fragmented approach to monitoring is particularly inefficient during the critical moments when failures occur.
Status Pages are the standard practice for cloud service providers to publicly communicate service health. Most providers use Atlassian Statuspage, Instatus, or custom-built pages to publish service status, typically including levels like Operational, Degraded Performance, Partial Outage, and Major Outage. However, these status pages have inherent limitations: providers tend to delay publishing outage information or understate severity to protect their brand image—a phenomenon known in the industry as "Status Page Lag." Additionally, different providers use varying formats, update frequencies, and data structures with no unified standard, which is precisely why aggregation tools exist.
OutageDeck, which recently appeared on Product Hunt, targets exactly this pain point—it aims to consolidate the real-time health status of every cloud service your tech stack depends on into a single unified status page.
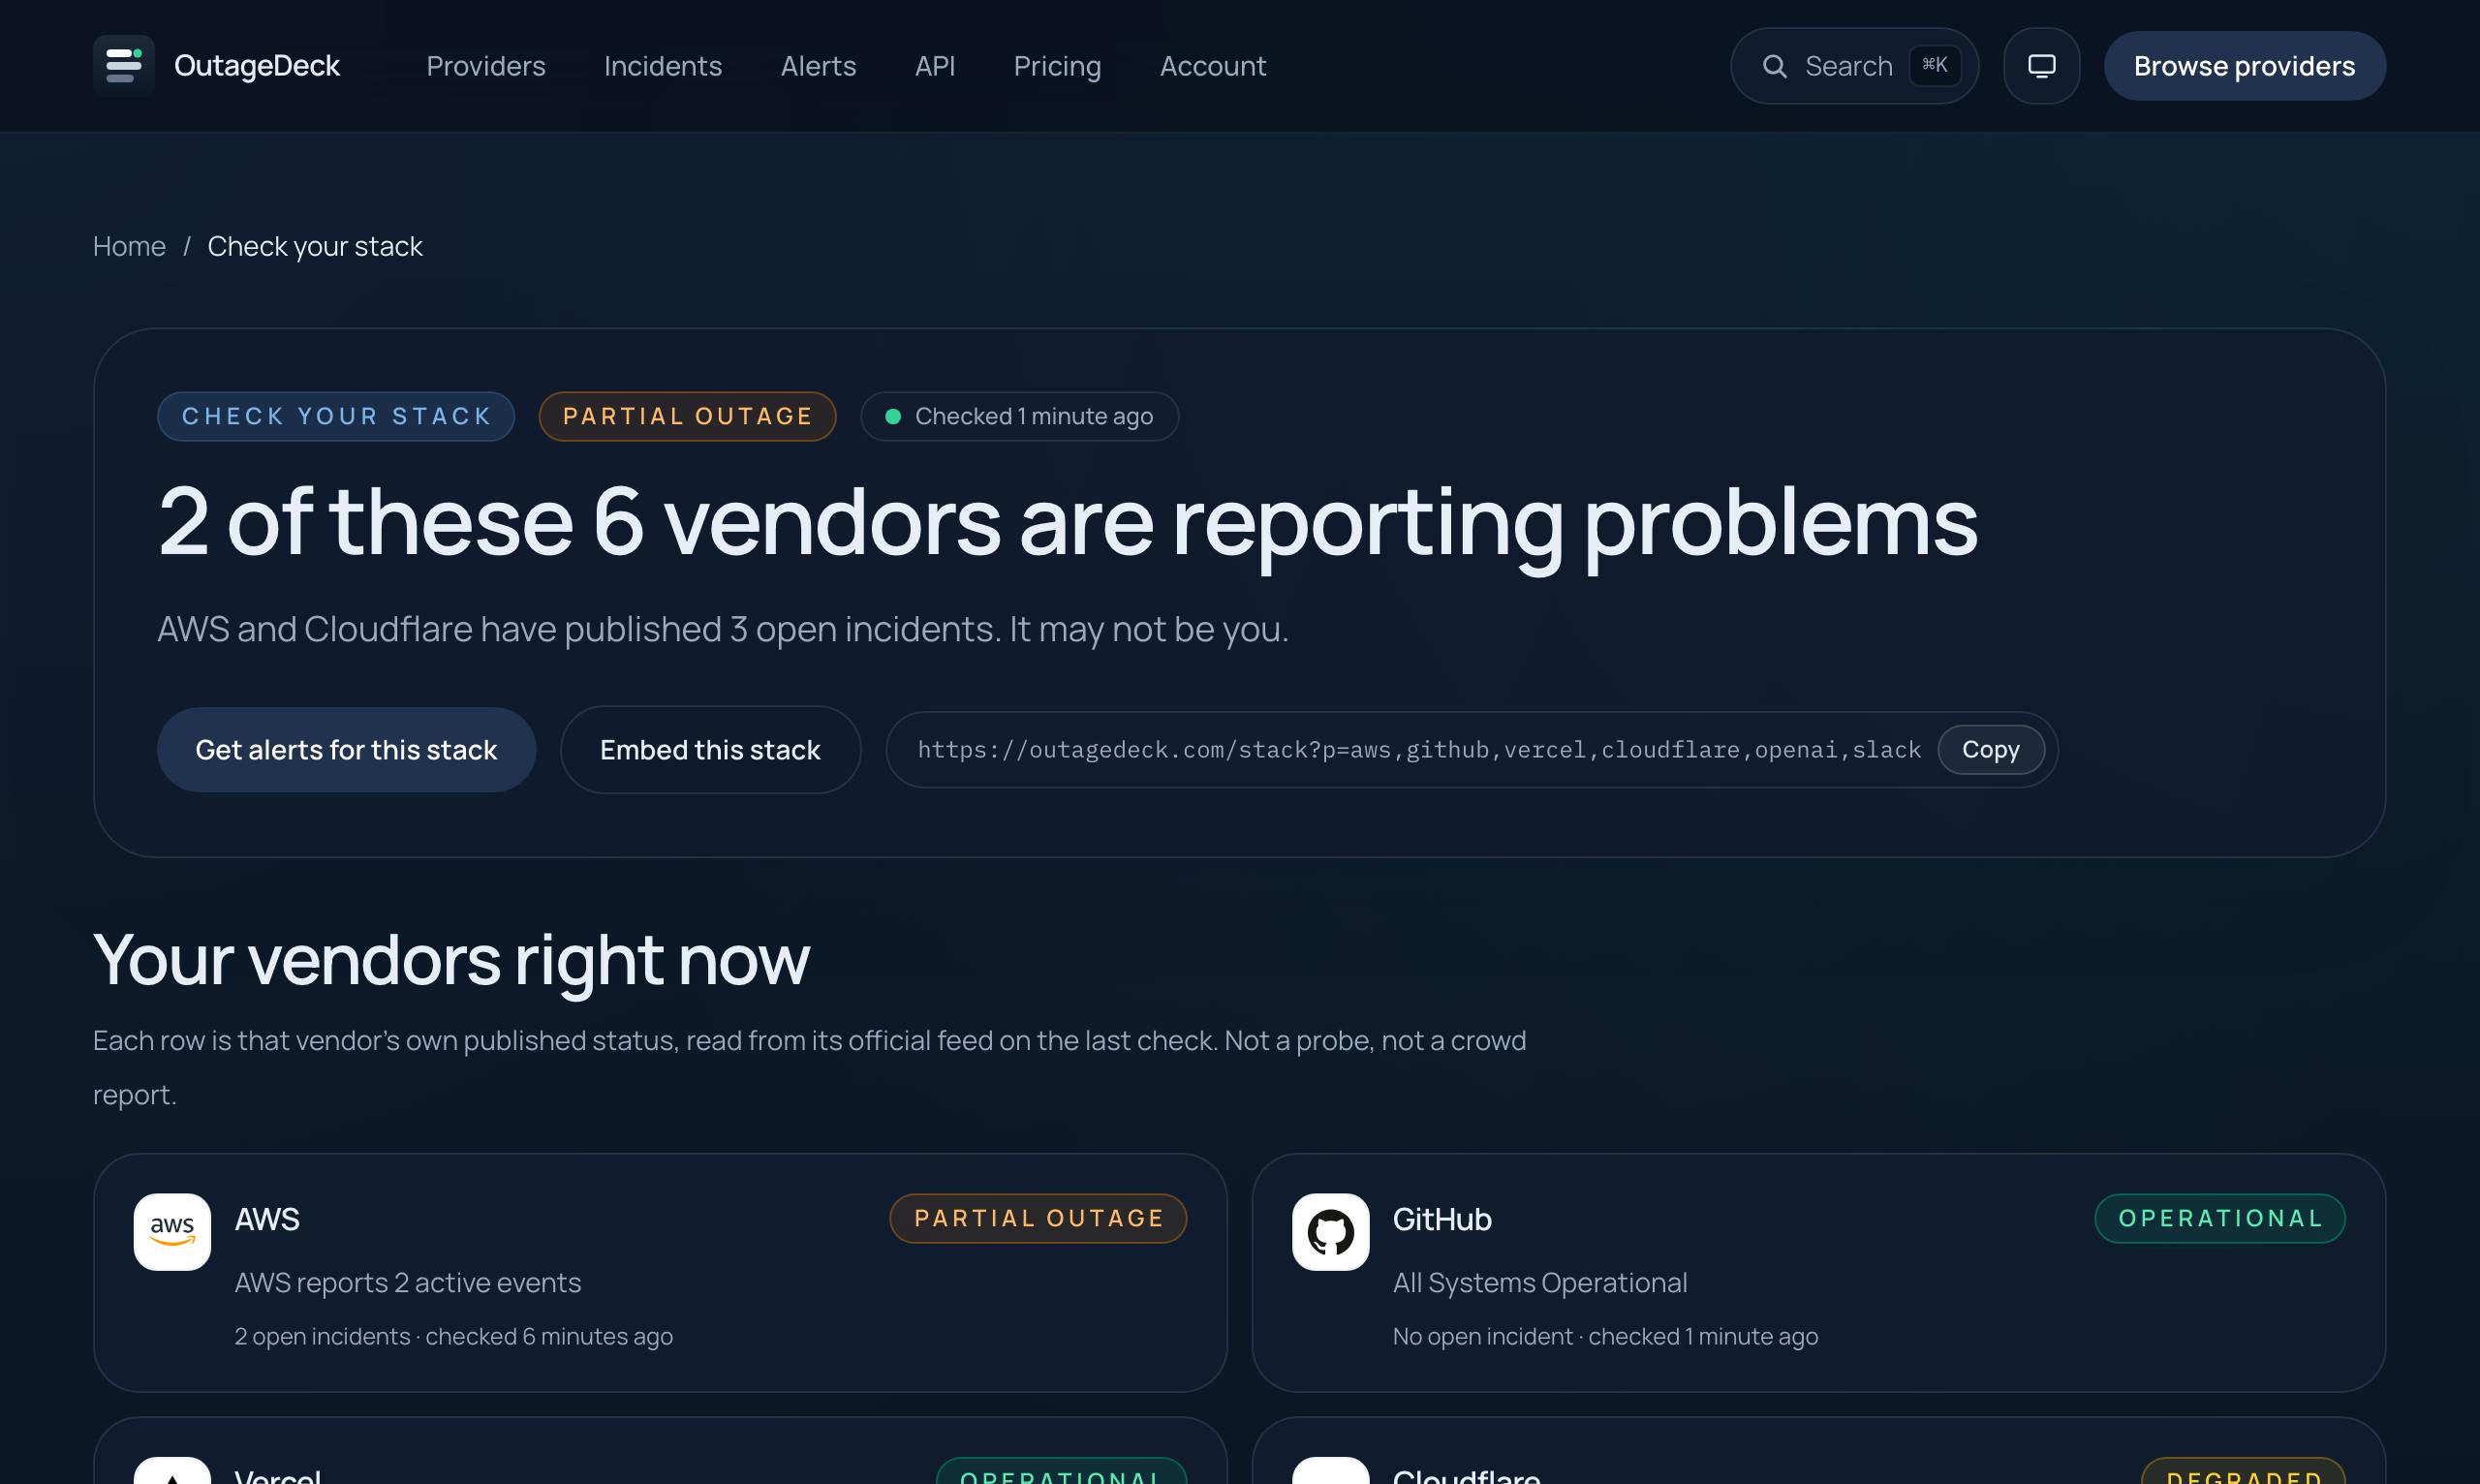
OutageDeck's Core Feature: Status Aggregation from 172 Providers
Real-Time Monitoring Driven by Official Data Sources
OutageDeck's core capability is tracking the operational status of 172 cloud services and SaaS providers from official data sources. This number covers the vast majority of infrastructure and third-party services that mainstream developers use.
A key positioning worth emphasizing: all data comes from official feeds—no crowdsourcing, no web scraping. This may seem like a minor detail, but it's actually crucial.
In the outage monitoring space, data collection methods directly determine monitoring quality. Crowdsourcing models rely on users to actively report outages—Downdetector being a typical example. Its advantage is catching outages that providers haven't yet acknowledged, but the downside is noise and false positives—users might mistake their own network issues for a service outage. Web scraping uses crawlers to periodically fetch status page content, but faces anti-scraping mechanisms and parsing failures when page structures change. By contrast, official feeds are typically based on Atom/RSS subscriptions or official API endpoints, offering stable data structures, lower latency, and provider-confirmed information with higher authority and reliability. The tradeoff is that coverage is limited to providers that expose machine-readable status data.
OutageDeck's direct integration with official status feeds means its alerts are more trustworthy and timely, genuinely reflecting the outage status that providers themselves have confirmed.
Alerts, History, and Free JSON API
Beyond real-time status display, OutageDeck offers several developer-friendly features:
- Alerts: Proactive notifications when dependent services experience issues—no manual screen-watching required.
- History: Retains past incident records for post-mortem analysis and availability reporting.
- Free JSON API: Developers can integrate status data directly into their own monitoring dashboards, ops workflows, or internal tools.
The free JSON API means OutageDeck isn't just a "dashboard"—it's a data service that can be embedded into automated workflows.
Designed for the AI Era: Built-in MCP Server for Agent Queries
Among all its features, the most forward-looking is OutageDeck's provision of an MCP (Model Context Protocol) Server for direct AI Agent queries.
MCP is a protocol standard proposed and open-sourced by Anthropic in late 2024, designed to solve interoperability issues between Large Language Models (LLMs) and external data sources/tools. Before MCP, every AI application needed custom integration code for each external tool, creating M×N integration complexity. MCP reduces this to M+N by defining a standardized client-server communication protocol—any MCP-compatible AI client can connect to any MCP Server without additional adaptation. MCP Servers can expose three types of capabilities: Resources (data resources), Tools (callable tools), and Prompts (predefined prompts).
In OutageDeck's case, its MCP Server primarily exposes service status query Tools and Resources, enabling MCP-compatible AI clients like Claude and Cursor to directly query outage information. This means you can ask your AI assistant "Which services in my tech stack are currently experiencing outages?" and the Agent will pull real-time data from OutageDeck to provide an answer—enabling natural language-driven ops diagnostics.
This design aligns with current trends in ops automation. SRE (Site Reliability Engineering) is an engineering practice pioneered by Google in 2003, with the core philosophy of using software engineering methods to solve operations problems. SRE teams typically manage SLI (Service Level Indicator), SLO (Service Level Objective), and SLA (Service Level Agreement) compliance. In alert triage scenarios, one of the SRE engineer's primary tasks after receiving an alert is determining whether the failure originates from an external dependency—precisely the problem OutageDeck solves. According to PagerDuty's industry reports, approximately 30% of production incidents are ultimately attributed to third-party service outages. If external factors can be quickly ruled out or confirmed early in the alert process, it significantly reduces MTTR (Mean Time To Recovery).
As more teams experiment with AI Agents for alert triage and fault diagnosis, whether an Agent can conveniently access authoritative status data directly determines the reliability of automated operations. OutageDeck's proactive embrace of MCP—embedding itself into AI-driven ops workflows—is a strategically astute choice.
Paid Features: Private Status Pages Integrated into a Unified View
For paid accounts, OutageDeck allows users to add private Statuspage or Instatus providers—including their own product's status pages.
This means a team can monitor external dependencies (AWS, Stripe, etc.) while also integrating their own internal status pages into the same view. For teams maintaining multiple product lines or microservices, this delivers "one-stop" observability: whether a failure originates from an upstream vendor or their own services, everything is visible in a single place.
Statuspage was acquired by Atlassian in 2016 and is currently the market leader in hosted status page services, widely adopted by companies like Datadog, Twilio, and Dropbox. It offers component-level status management, incident updates, email/Webhook subscriptions, and pricing ranging from free to enterprise tiers. Instatus is a lightweight alternative that has gained traction in recent years, winning over small and mid-sized teams with faster page load speeds (claiming to be 10x faster than Statuspage) and more competitive pricing. Both provide API and Webhook integration capabilities, enabling OutageDeck to pull private status page data through standardized interfaces. For teams operating multiple product lines, unifying status information scattered across different Statuspage or Instatus instances into a single view effectively eliminates information silos and improves cross-team collaboration.
Product Assessment: A Small Tool Solving Real Ops Pain Points
OutageDeck is a low-key but clearly positioned tool on Product Hunt. It doesn't try to reinvent the wheel—instead, it elegantly solves a real ops pain point—the fragmentation of dependency service status—through aggregation.
From a product strategy perspective, three highlights deserve recognition:
- Trustworthy data sources: Commitment to official feeds without scraping or crowdsourcing ensures alert authority.
- Open integration: The free JSON API lowers the barrier to adoption, enabling integration into existing toolchains.
- AI foresight: The built-in MCP Server positions it ahead of the curve for AI Agent-era ops needs.
Of course, as an aggregation tool, its moat lies in continuously maintaining the accuracy and timeliness of 172 (and growing) data sources—requiring sustained operational investment. But for developers and SRE teams who deal with multiple cloud services daily, OutageDeck provides a low-cost, worth-trying unified monitoring entry point.
If your tech stack relies on numerous third-party services and you're tired of switching between countless status pages, this tool might help you refocus your attention on what truly matters.
Related articles

FlexBudget: Fair Comparison of KV Cache Eviction Strategies Under a Unified Compute Budget
AMD engineer proposes FlexBudget at PyTorch Conference: a training-free fair comparison method for KV cache eviction rules using fixed kernels and memory budgets, all in core PyTorch.

Anthropic's $2 Trillion Valuation Deconstructed: Why the AI IPO Wave Keeps Faltering

Anthropic IPO Countdown: The Compute Cost Ledger Behind a $2 Trillion Valuation
Anthropic's IPO targets up to $2 trillion — double its Series H valuation. We break down the timeline, compute cost logic, and the key question investor day must answer.