The 7-Step Support & Resistance Trading Method: A Replicable Strategy Breakdown

A 7-year trader's Support & Resistance system: 55% win rate, 2.4R ratio, and positive expected value over flash.
A seven-year trading veteran shares his only long-term strategy: waiting for reversal confirmation at key support/resistance zones with strict risk/reward discipline. The system uses multi-timeframe analysis — marking zones on the 4-hour chart and switching to the 1-minute chart for precise entries — requiring at least a 2:1 risk/reward ratio on every trade. Real data shows a ~55% win rate and 2.4R average over the past year, producing a positive expected value of +0.87R per trade. The author admits the approach takes years to master, and readers should separate the methodology from the paid community promotion embedded in the content.
A trader with seven years of experience has publicly shared what he claims is the only trading strategy he'll ever need. The approach is unflashy — even tediously repetitive — but according to him, that systematic, replicable quality is precisely what has kept it consistently profitable over the long run. This article offers a complete breakdown of his seven-step Support & Resistance trading method, including his actual win rate and risk/reward data.
Risk Disclaimer: Trading carries significant risk of capital loss. This article is purely a methodological analysis and does not constitute investment advice. Past performance mentioned here does not guarantee future results.
Why Support & Resistance?
The underlying logic of this strategy is straightforward. The author sums it up in one sentence: only trade at known zones where price is likely to reverse — whether that's a resistance zone or a support zone.
He uses a vivid analogy to make it stick: resistance is the "ceiling" that price struggles to break above; support is the "floor" that price struggles to fall through. Take Bitcoin as an example — every time price rallies to a certain high and the market broadly chooses to sell, a resistance zone forms. Every time price dips to a certain low and buyers step in seeing value, a support zone forms.
The critical point, however, is that the author emphasizes reaching a zone does not mean entering immediately. Price doesn't reverse every single time it touches resistance, so blindly shorting on contact is a mistake. He waits for a "reversal confirmation signal" after price enters the zone before looking for an entry.
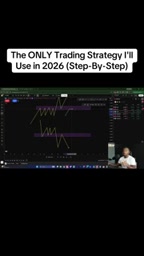
Break and Retest: Capturing Opportunities in Both Directions
The strategy also covers breakout scenarios. When price breaks through a resistance zone, it often pulls back to "retest" that zone — at which point the former resistance flips to support and a bounce forms. Conversely, when price breaks below support, it often retests from below, with the former support acting as new resistance. This Break and Retest structure allows traders to capture opportunities whether price reverses directly or breaks out first and then retests.
Analyst Note: The Break and Retest is one of the most enduring core structures in technical analysis, with clear market microstructure logic behind it. When price breaks through a resistance zone, traders who were short in that area are forced to cover their stops, while fresh longs pile in — pushing price higher. The subsequent pullback to retest the former resistance occurs because early longs take profits and traders who missed the initial breakout use the retest to enter. This convergence of forces is why the flipped support after a breakout tends to be particularly reliable, with tighter stop-loss placement. The key to distinguishing a genuine breakout from a false one typically lies in volume expansion during the break and whether price closes outside the zone — false breakouts are usually accompanied by shrinking volume and a failure to close beyond the level.
The Seven-Step Checklist in Practice
The author has codified this approach into a seven-step checklist. Here's how the core process breaks down:
- Step 1: Mark highs and lows on the 4-hour chart. He stresses timeframe selection — the lower the timeframe, the more "fakeouts" there are; the higher the timeframe, the more respected the support and resistance levels. Zones on a 1-minute chart are far less reliable than those on a 4-hour or daily chart. He also mentions using higher-timeframe candlestick charts to better identify true zones.
- Step 2: Set price alerts. Use alerts on TradingView or similar platforms at key zones — when price approaches, you get a push notification or email, so you don't have to stare at screens all day.
- Step 3: Do nothing until an alert fires. The author is candid: patience is the core skill. All price movement before reaching a zone is "noise" — he never forces an entry.
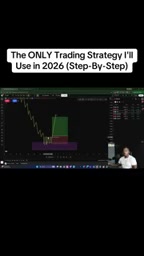
Dropping from the 4-Hour to the 1-Minute Chart for Entry
Once an alert triggers and price enters the 4-hour zone, the workflow shifts to the 1-minute chart to find a more precise entry signal. At this point, he waits for one of two setups: a consolidation breakout (price consolidates sideways and then breaks out in the intended direction), or a break of the most recent swing high/low.
The specific entry rules are clearly defined:
- Long: Enter when price breaks above the most recent swing high; stop loss goes below the most recent swing low; target is the nearest high.
- Short: The reverse — enter on a break of the most recent swing low; stop loss above the swing high.
- Every trade must offer at least a 2:1 risk/reward ratio — otherwise, skip it.
Analyst Note: Multi-Timeframe Analysis (MTF) is the standard method professional traders use to manage entry precision and stop-loss distance. The core idea: higher timeframes (e.g., 4-hour, daily) define direction and key price zones; lower timeframes (e.g., 1-minute, 5-minute) identify precise trigger signals. The higher timeframe provides "structural edge" — only trade in the direction of the prevailing structure. The lower timeframe offers entries closer to actual support/resistance, compressing stop-loss distance and improving risk/reward. Entering directly on a 4-hour chart might require a stop wide enough to cover the entire zone; switching to the 1-minute chart and waiting for a swing high/low break allows for a much tighter stop — meaning you can size larger or achieve a higher potential return for the same dollar risk.
Live Examples and Trading Sessions
The author reviews several live trades on charts. One notable detail: he only trades between 7:00 AM and 12:00 PM Central Time, as market volume is most active during this window. Even if price has already touched a zone overnight, he waits for price to retest it during his trading hours.
He also mentions a risk management habit — if an entry signal appears within five minutes of the 8:30 AM CT market open, he stands aside. The opening candle often brings violent moves, and entering too early risks getting stopped out. In one NQ futures Break and Retest example, waiting past the opening candle allowed him to avoid a false breakout stop-out, and he subsequently entered short on a more reliable signal and profited.
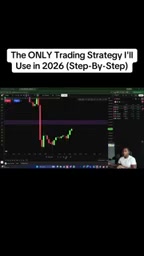
The strategy is primarily applied to equity index futures like NQ, ES, and YM, but can also be used on crypto and medium-to-long-term equity positions.
The Real Numbers: The Logic Behind a 55% Win Rate
The most honest part of this strategy is the data disclosure. The author openly admits the statistical performance is "nothing remarkable": over the past year, the average win rate is approximately 55% with an average risk/reward ratio of 2.4.
Translated: out of every 10 trades, 5 to 6 are winners, but each winning trade earns 2.4 times the amount risked. Risking $1,000 per trade, a win yields roughly $2,400. It is this positive expected value structure — winning more per trade than you lose — that underpins long-term profitability, not some magical high-win-rate indicator.
This gets at one of the most underappreciated truths in trading: sustainable profitability comes from positive expected value and disciplined execution — not from a flashy strategy. The author repeatedly describes his method as "boring, repetitive, and making you feel like you're not doing enough" — but that replicability is precisely what creates consistency.
Analyst Note: "Expected Value" (EV) is the core mathematical concept for understanding this strategy's long-term profitability. The formula is: EV = (Win Rate × Average Win) − (Loss Rate × Average Loss). Plugging in the numbers: 55% × 2.4R − 45% × 1R = 1.32R − 0.45R = +0.87R — meaning for every 1 unit of risk taken, the strategy is expected to return 0.87 units on average over time. Even though nearly half of all trades lose, strict execution means the math still guarantees a positive return. By contrast, many strategies that chase high win rates (e.g., 80%+) often sacrifice risk/reward (e.g., 0.3:1) for psychological comfort — and may actually carry negative expected value. Understanding this helps explain why professional traders consistently prioritize risk/reward ratio over raw win rate.
A Clear-Eyed Assessment: The Reality Beyond the Methodology
For most readers, this framework is methodologically clear and classically sound — support/resistance, multi-timeframe analysis, fixed risk/reward, strict stop-losses are all standard components of any mature trading system.
But a few things warrant a grounded perspective:
First, the author himself says it took him "three years to achieve consistent profitability" and "seven years to refine this strategy" — a reminder that trading has no shortcuts. Second, the video does not provide a complete, independently verifiable historical backtest; claims of "six-to-seven-figure annual income" are self-reported. Third, the latter half of the content visibly promotes a paid "inner circle" and other "leverage strategy" videos — readers should clearly separate the marketing from the methodology itself.
As a beginner-friendly trading framework, the value of this seven-step checklist lies in its emphasis on discipline and expected value. But real profitability has never been something anyone can replicate simply by copying a set of rules.
Related articles

Python 3.15 New Feature: Is the sentinel Type Better Than None?
Python 3.15 adds the sentinel type, using named unique sentinel objects to replace None and bare object(), resolving confusion among missing values, explicit emptiness, and invalid input while avoiding type hint failures.

Deep Learning's Three Architectures and the Universal Approximation Theorem: A Complete Guide to MLPs, CNNs, and Transformers
Explaining the inductive bias differences among MLP, CNN, and Transformer, the existence meaning of the Universal Approximation Theorem (UAT), and the role of Taylor expansion in approximation analysis, while clearing up common misconceptions.

GitLab Emergency Patch Release: Analysis of Critical Security Fixes
GitLab releases critical patch 19.5.1, sparking 355 points of discussion on Hacker News. This article analyzes the background, upgrade steps for self-hosted instances, and verification points to help DevOps teams respond quickly to security updates.