The Gemini 4 Neon Coding Test Mystery: 39% vs. 12.8% — Tool Differences or Model Capability?

Gemini 4 Neon's stark score gap on a SWE-bench-style test highlights how toolchain differences affect evaluation.
The article analyzes the huge discrepancy between Gemini 4 Neon's scores of 39% and 12.8% on the same SWE-bench-style benchmark, pointing to different test setups: provider tools (such as Anti-Gravity CLI) versus the mini-SWE-agent framework. The gap with GPT-6.2 Sol shrinks from 30.7 to 1.2 percentage points, showing the toolchain's significant impact. Google's report does not isolate a single variable and cannot attribute the gap to model capability. Cross-validation with Terminal Bench 4.1 and Frontier Code 2.0 shows Opus narrowly leading Neon, indicating a single leaderboard row cannot serve as a universal conclusion. The article recommends controlled testing based on the decision scenario, fixing tasks, time, and budget, measuring useful fixes, regressions, time taken, and total cost, and repeating trials for stability.
Same Benchmark, Two Scores: How Good Is Gemini 4 Neon at Coding, Really?
On the same SWE-bench-style benchmark, Gemini 4 Neon scores 39% in one setup and only 12.8% in another. That gap isn't a fluctuation past the decimal point — it's more than a threefold difference. More intriguingly, when the test environment switches from "provider tools" to "mini-SWE-agent," its gap with GPT-6.2 Sol suddenly shrinks from 30.7 percentage points to just 1.2 points.
According to analysis by the YouTube channel FinePrint AI, the numbers in Google's official report do not isolate a single variable — different agent tools and different runtime frameworks make score comparisons unusually complicated.
What Does SWE-bench Actually Measure?
SWE-bench gives an agent a real code repository and a broad task: find and fix as many bugs as possible. It does not tell the agent which files or issues contain bugs. The benchmark verifies fixes with hidden tests and the existing test suite, and the score counts the number of reference bugs fixed across repositories, including regression checks.
So 39% absolutely does not mean "Gemini can solve 39% of all coding tasks." It only means that in this particular task setup, the agent fixed about four out of ten reference bugs — and that number is highly dependent on how the agent uses its tools.
SWE-bench is a benchmark proposed in 2023 by Princeton University and other institutions to evaluate language models on real software engineering tasks. It collects thousands of real issues and corresponding pull requests from GitHub, covering multiple mainstream Python repositories. Each task requires the agent to modify the codebase based on the issue description so that it passes hidden test cases. The benchmark comes in "full" and "lite" versions, the latter used to reduce costs. SWE-bench emphasizes end-to-end problem solving rather than simple code completion, so it places high demands on an agent's tool use, multi-step reasoning, and code understanding. Its scoring standard is strict: a fix only counts as successful if all hidden tests pass, which avoids inflated scores from partial correctness.
Behind the Two Rows of Data: How Big Is the Toolchain Difference?
Both rows Google published are its own calculations, not data from the benchmark creators' leaderboard.
In the "provider tools" row, Neon uses Anti-Gravity CLI 1.5.9 and scores 39%; Opus uses Cloud Code; Sol uses Codex. These are comparisons between complete setups, not pure model comparisons.
Under the "mini-SWE-agent" setup, Neon scores 12.8%, Opus scores 3.6%, and Sol scores 11.6%. Neon still leads, but Sol closes in dramatically and overtakes Opus.
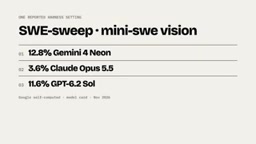
The gap for Neon between the two setups is 26.2 percentage points, with the high score more than three times the low score. Google explains that Anti-Gravity has a default tool that lets sub-agents search the codebase in parallel — which fits bug-search tasks perfectly. This is a meaningful tool difference, but Google's summary does not prove that sub-agents caused the entire gap, nor can it even quantify their contribution. Time, cost, prompts, and actual sub-agent usage all affect how the results are interpreted.
Only Controlled Variables Reveal the Truth
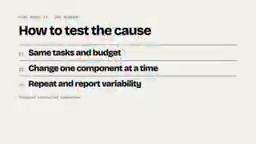
A controlled experiment should fix the task set and budget, record all settings, and change only one component at a time. Multiple trials are needed to show the stability of the gap. FinePrint AI points out that Google's report does not establish a "all else being equal" premise, so the chasm between 39% and 12.8% cannot simply be attributed to model capability.
The controlled variable method is a core principle of experimental design and is especially important in machine learning evaluation. It requires changing only one independent variable while keeping all other conditions constant, thereby isolating that variable's effect on the results. In AI agent benchmarks, this means fixing the task set, prompts, budget, time limits, toolchain versions, and so on. However, real-world evaluations are often difficult to fully control, because different agent frameworks may come with different default tools or optimization strategies. For example, a sub-agent parallel search feature can significantly affect performance on search-type tasks, but if it is not explicitly isolated in the experiment, its contribution cannot be quantified. Therefore, comparisons lacking controlled variables can only provide correlation rather than causal conclusions, and can easily mislead decision-making.
Do Other Coding Tests Tell the Same Story?
Looking at SWE-bench alone makes it easy to fall into the trap of "a single leaderboard row is a universal conclusion." Cross-validating with other benchmarks provides a more complete picture.
In Google's table, on Terminal Bench 4.1, Opus leads Neon by only 0.6 percentage points, and Sol trails both. Note that the data sources are not uniform: Google's evaluation states that Neon's Terminal Bench result comes from an Artificial Analysis run in Anti-Gravity, while the other Terminal Bench results come from public leaderboards.
On Frontier Code 2.0, Opus leads Neon by 1.1 percentage points, and Sol ranks third. The Frontier Code results also come from its public leaderboard, and Google says Neon's result used high thinking mode.
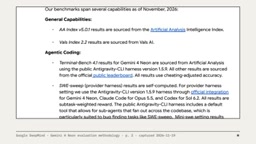
These tests' conclusions do not contradict SWE-bench — they each measure different capabilities, so they cannot be used to "offset" SWE-bench results, but they are enough to show that making universal judgments based on a single leaderboard row is dangerous.
Practical Advice: How to Choose Comparisons Based on Your Decision
FinePrint AI's conclusion is straightforward: choose the comparison that matches your decision.
- If you are purchasing a complete coding agent: test the entire setup on your own repository, keeping the same tasks, time, and spending limits.
- If you are choosing a model for an existing agent: keep the agent as unchanged as possible and test the effect of swapping in the model separately.
- Metrics: number of useful fixes, number of regressions, time taken, total cost.
- Repeat trials: run the tasks multiple times to confirm stability before declaring a winner.
Google's numbers make "Neon + Anti-Gravity" a combination worth investigating in depth, but they do not tell us that the model itself or any single feature explains the entire difference. For developers and technical decision-makers, rather than obsessing over a single percentage on a leaderboard, it is better to run controlled tests in your own real workflow — that is the number that means the most to you.
Background
Terminal Bench is another benchmark that evaluates AI agents on tasks in command-line environments, focusing on capabilities such as file operations, process management, and system interaction. It simulates real terminal scenarios, requiring agents to complete specified tasks via shell commands and checking the final state. Unlike SWE-bench, Terminal Bench focuses more on an agent's proficiency with the operating system and toolchain rather than code fixes. Frontier Code, meanwhile, is a code generation benchmark that evaluates a model's ability to generate correct code from natural language descriptions, typically including function-level and project-level tasks. These two benchmarks complement SWE-bench, measuring different aspects of an agent: terminal operations, code generation, and problem fixing. Therefore, when comparing across benchmarks, note that they measure different capability dimensions and cannot simply substitute for or offset one another.
Related articles
Gemini 4 Neon Builds a Minecraft Clone in One Shot: Magic and Faceplants
Gemini 4 Neon beats Claude Opus 5.5 on one-shot prompts, but cold-start tests expose broken water physics and weak bash reliability. We break down API pricing traps, the power of 8-agent Swarm, and when to use Neon vs GPT 6.2 Sol.
Gemini 4 Neon vs Claude Opus 5.5: When Benchmarks and Real Code Tell Opposite Stories
Gemini 4 Neon wins 16 of 19 benchmarks, but Opus beats it by 7 points on production code. How AntiGravity skews scores and how to pick a model by task.
Gemini 4 Neon vs Claude and GPT: Is the Throne Changing Hands?
Google's Gemini 4 Neon tops Claude Opus 5.5 and GPT 6.2 Sol across multiple tiers on Artificial Analysis, with clear edges in autonomous coding and long context—63% lower cost and six times faster first response. A breakdown of benchmarks, real deliverables, and safety metrics.