The Homelab Tool Overlap Dilemma: Specialize or Integrate?

When Homelab tools multiply, feature overlap becomes inevitable — here's how to think through the modular vs. integrated tradeoff.
A Homelab enthusiast discovered significant feature overlap across their stack after achieving a stable setup: Dashdot, Arcane, and WGDashboard all monitor system resources, while Traefik, Crowdsec, and Prometheus/Grafana collect overlapping metrics. The article uses this as a lens to examine the fundamental tension between modular (decoupled, replaceable) and integrated (convenient, but tightly coupled) approaches to self-hosting. The key conclusion: overlap itself isn't the problem — unmanaged overlap is. Tools like a feature matrix and distinguishing critical-path services from nice-to-haves can help maintain intentional boundaries.
When Your Homelab Runs Smoothly, the Real Headaches Begin
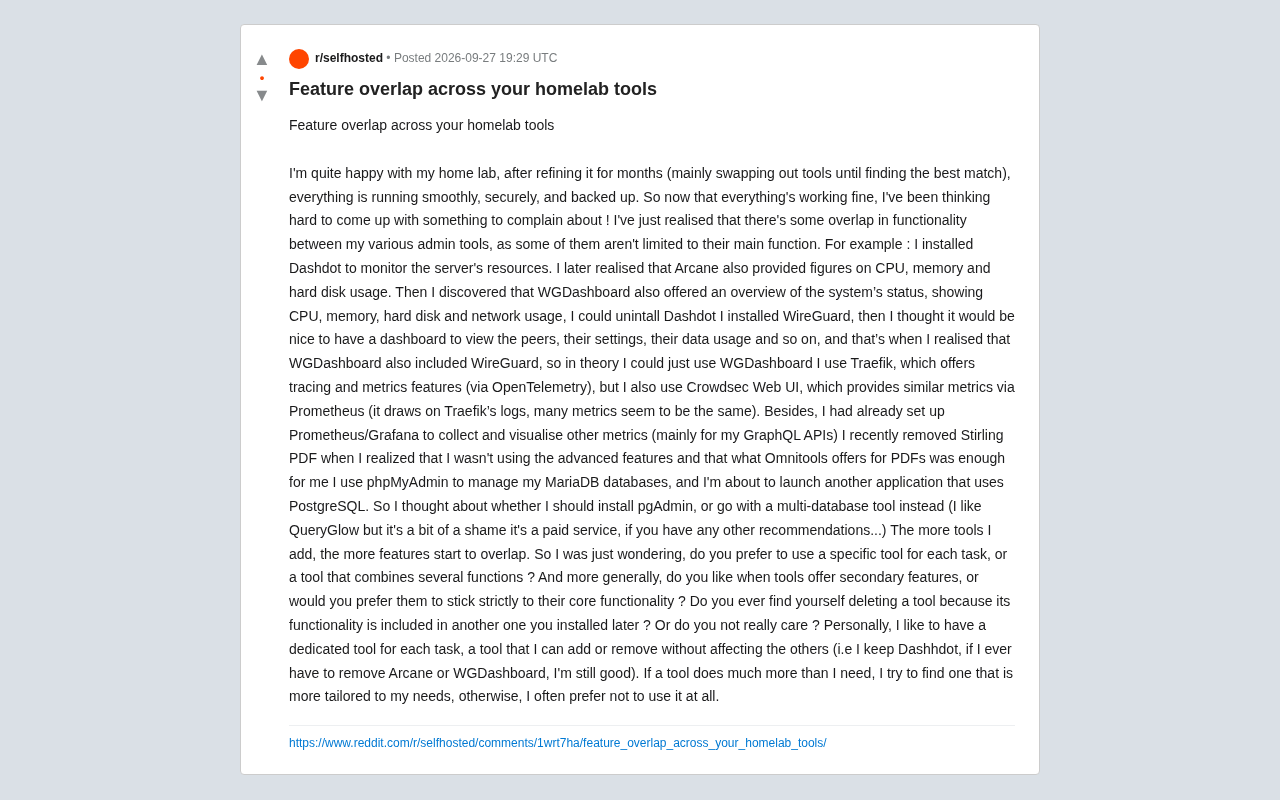
A Reddit user spent months tinkering with their home lab, swapping tools in and out until landing on the right combination. The system now runs smoothly, is secure, and has backups in place. But once everything just worked, they started looking for a new problem to solve — and found one: the many management tools they'd installed had significant feature overlap.
This is a classic problem that practically every self-hosting enthusiast runs into: the more tools you add, the blurrier the boundaries get. A tool originally designed for a single task quietly grows to include monitoring, dashboards, and metrics visualization as side features — and suddenly it's stepping on the toes of another solution you already have.
A Cascade of Real-World Overlaps
The user's examples are refreshingly relatable — almost every one will resonate with fellow Homelab enthusiasts.
Triple Coverage for Resource Monitoring
They originally installed Dashdot to monitor server resources. Then they discovered Arcane also provides CPU, memory, and disk usage data. Then they realized WGDashboard has a built-in system overview too, showing CPU, memory, disk, and even network usage. Three tools, one monitoring need — in theory, Dashdot could be uninstalled entirely.
WireGuard and Its Dashboard
They deployed WireGuard first, then wanted a dashboard to view peers, configurations, and traffic data. It turned out WGDashboard already has WireGuard built in — meaning they could have handled everything with WGDashboard alone from the start.
Parallel Metrics Collection
The observability stack is even messier. They use Traefik, which provides tracing and metrics via OpenTelemetry. They also run the Crowdsec Web UI, which exposes similar metrics via Prometheus — sourced directly from Traefik's logs, making many metrics nearly identical. And they already had Prometheus/Grafana set up to collect and visualize other metrics (primarily for a GraphQL API). Three metrics pipelines overlap, with data sources that are practically identical.
These three tools operate at different layers of the observability stack. OpenTelemetry is an open standard from the Cloud Native Computing Foundation (CNCF) that unifies the collection protocols for tracing, metrics, and logs — Traefik natively exports its routing data in OTEL format. Prometheus is a separate time-series database and pull-based metrics collection system; Crowdsec exposes a
/metricsendpoint that Prometheus scrapes on a schedule for security event stats. Grafana typically serves as the visualization frontend, connecting to both Prometheus and OTEL backends. The three could divide responsibilities cleanly — but when Traefik logs are simultaneously parsed by Crowdsec and scraped directly by Prometheus, the same raw data ends up generating metrics like "HTTP request rate" in multiple systems. Minor discrepancies arise from different calculation methods, causing confusion during troubleshooting.
PDF Tools and Database Clients
The user also mentioned recently uninstalling Stirling PDF after realizing they never used its advanced features, and that Omnitools covered their PDF needs just fine. On the database side, they use phpMyAdmin for MariaDB, but an incoming app requires PostgreSQL — leaving them debating whether to add pgAdmin or switch to a multi-database tool. They like QueryGlow, but it's a paid service.
The Core Tension: Modular vs. Integrated
Under all these examples lies a philosophical question that every self-hosting community grapples with:
Do you prefer one dedicated tool per task, or one multi-purpose tool that can wear many hats?
The poster's position is clear — they prefer modularity. They like having a dedicated tool for each task so they can add or remove any component without affecting the rest. That's why they're keeping Dashdot: even if Arcane or WGDashboard is removed someday, monitoring capability stays intact.
They also shared a filtering principle: if a tool does far more than they actually need, they look for a leaner alternative — and if they can't find one, they often go without.
At its core, this preference is a pursuit of decoupling. In systems architecture, low coupling means higher maintainability and reduced risk of cascading failures. When each tool has clear boundaries and a single responsibility, replacing components and debugging issues both become much simpler.
This tension maps to the classic Unix philosophy vs. monolithic application debate in software engineering. The Unix philosophy advocates "do one thing and do it well," with programs collaborating through standard interfaces (pipes, files). Modern integrated tools — like WGDashboard combining VPN, dashboard, and monitoring — lean toward monolithic design, trading flexibility for deployment convenience. In containerized environments (Docker/Podman), the cost of modularity is amplified: each service occupies its own container image, and cold start times, network namespace overhead, and persistent volume management all scale linearly with container count. This is why some Homelab enthusiasts develop a "container count OCD" — deliberately capping the number of running containers as a rough indicator of system health.
The Hidden Costs of Each Approach
Modularity sounds appealing, but it comes with real costs. Stacking specialized tools means:
- Cumulative resource overhead: Every container or service consumes memory, CPU, and storage. Running multiple monitoring tools that perform the same collection logic is inherently wasteful.
- Larger maintenance surface: More tools means more things to update, patch, and watch for security vulnerabilities — and a larger attack surface.
- Fragmented data: Information scattered across different dashboards actually increases cognitive load.
Integrated multi-function tools (like WGDashboard handling VPN, monitoring, and dashboard in one go) go to the other extreme: simple to deploy, unified access point, but highly coupled. If you want to swap out the main tool because one secondary feature doesn't satisfy you, everything is entangled. And tools that try to do everything tend to do each individual thing less deeply.
Secondary Features: Bonus or Noise?
Another question the poster raised is equally worth exploring: do you appreciate when tools include secondary features, or do you want them to stick to their core purpose?
There's no universal answer, but here's a useful framework:
- If a secondary feature fills a gap you haven't addressed yet, it's a net gain (e.g., WGDashboard's system monitoring saves you a separate deployment).
- If a secondary feature duplicates a specialized solution you already have, it's redundant — and may even cause confusion due to inconsistent data (e.g., Traefik, Crowdsec, and Prometheus all generating conflicting metrics).
In other words, feature overlap itself isn't the problem. Unmanaged feature overlap is. When you notice overlap, making an active decision — cut the redundancy, or keep it as a backup — is far better than letting tools sprawl unchecked.
Practical Advice for Homelab Enthusiasts
Building on this case, here are a few general principles worth considering:
- Define your core requirements before choosing tools. Avoid adding dependencies just because something "can also do" a thing.
- Draw a feature matrix. List what each tool does — overlaps become obvious, and cuts become easier to justify.
- Distinguish the critical path from nice-to-haves. Keep core services decoupled and independently replaceable; it's okay to accept integration for non-critical secondary functions.
- Prefer multi-engine solutions for database tools. When managing both MariaDB and PostgreSQL, a unified client reduces context-switching — beyond paid options like QueryGlow, open-source alternatives like DBeaver and Adminer are worth evaluating.
Ultimately, a Homelab is a deeply personal space. Some people love a clean, all-in-one setup; others enjoy snapping pieces together like LEGO. What matters isn't which path you choose, but knowing clearly why you chose it.
On the topic of multi-database management tools: the options mentioned each have their own niche. Adminer is a single-file PHP application that supports MySQL/MariaDB, PostgreSQL, SQLite, and more. It's extremely lightweight to deploy and works well for basic queries and schema management. DBeaver is an Eclipse-based desktop client (open-source community edition) that supports virtually every major database and feels closer to a professional IDE — but as a local application, it can't be accessed remotely through a browser the way a Web UI can. For those who want a unified Web-based interface, Adminer is typically the most low-friction compromise for Homelab use: a single container can replace both phpMyAdmin and pgAdmin, which aligns well with the article's core recommendation to reduce redundant tools.
Related articles

Felix Rieseberg Personal Homepage
Felix Rieseberg's personal homepage sparks attention on Hacker News. This article covers the Slack engineer's technical background, the rise and fall of nativefier, and the value of a developer homepage as a tech calling card.

@ai-sdk/vue 3.0.306 Patch Release Syncs with [email protected] Update
@ai-sdk/vue 3.0.306 released, synced with [email protected]. A routine patch release for the Vercel AI SDK ecosystem with no public API changes; the Vue adapter layer stays version-aligned with the core package.

Gemini 4 Argon API Launches: The Era of Million-Token Output Begins
Google launches Gemini 4 Argon with sparse MoE architecture, up to 1M output tokens, and a 68.90% Vals Index score, available across API, AI Studio, and the Gemini app.