TRACE Benchmark: How Official Operational Text Improves Electricity Price Forecasting Accuracy

TRACE benchmark proves official operational text cuts electricity price upper-tail forecast loss by 7.4%.
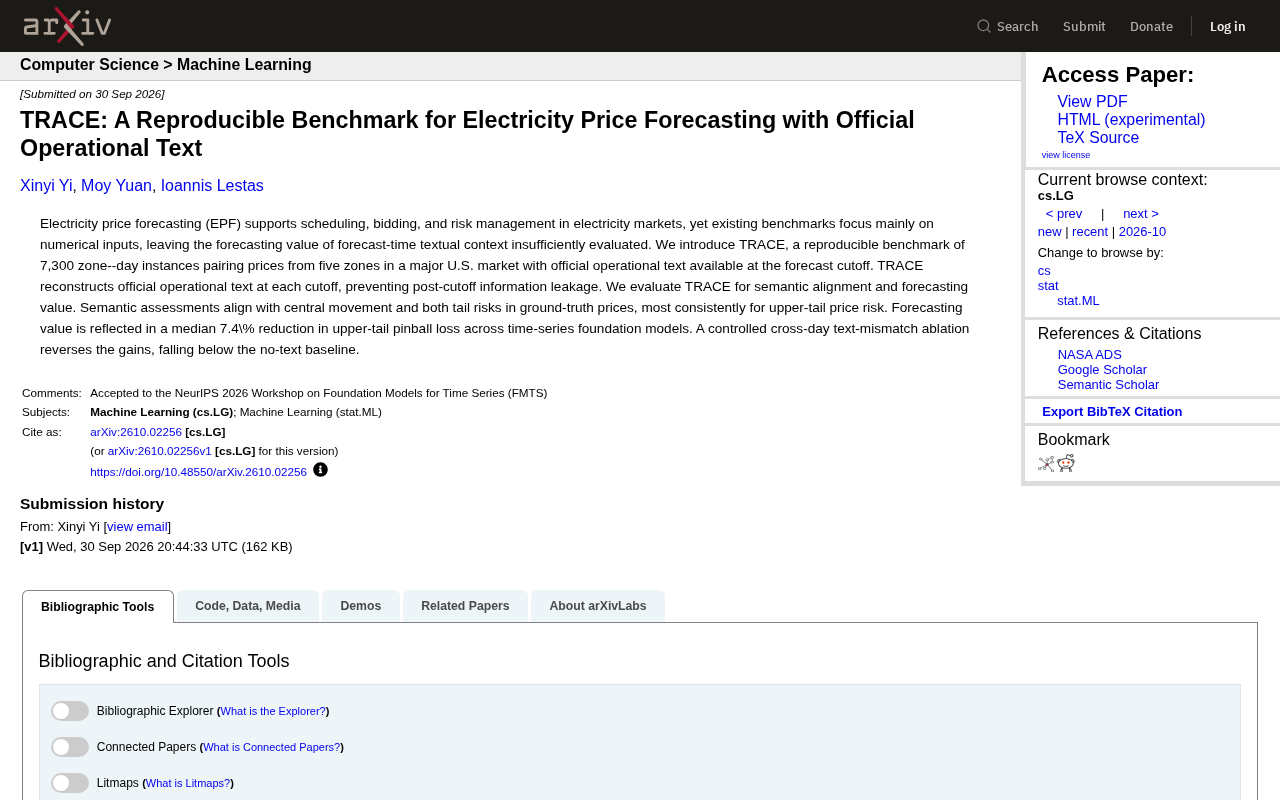
TRACE is a reproducible benchmark for electricity price forecasting with 7,300 zone-day instances across five zones in a major U.S. market, strictly aligning historical prices with official operational text at each forecast cutoff to prevent information leakage. Evaluation across two dimensions shows text aligns most consistently with upper-tail price risk, reducing median upper-tail pinball loss by 7.4% across multiple time-series foundation models. A cross-day text-mismatch ablation confirms the gains stem from genuine semantic relationships rather than noise. The benchmark establishes a rigorous evaluation paradigm for text-driven time-series forecasting with direct practical implications for electricity market risk management.
Why Electricity Price Forecasting Needs Text Information
Electricity Price Forecasting (EPF) plays a central role in power markets — covering scheduling, bidding, and risk management. Accurate price forecasts directly affect generator revenues and grid operational stability. Yet for a long time, the forecasting benchmarks used by both academia and industry have relied primarily on numerical inputs: historical prices, load data, weather parameters, and other structured information.
This approach overlooks an important information source: the official operational text available at forecast time. Power market operators regularly publish text-based communications covering system status, dispatch arrangements, and risk warnings. These textual descriptions may carry market signals that numerical data alone cannot fully capture. The TRACE benchmark was developed specifically to systematically evaluate the practical value of such textual context in forecasting.
Design and Scale of the TRACE Benchmark
TRACE is a reproducible electricity price forecasting benchmark comprising 7,300 zone-day instances. The data spans five zones within a major U.S. electricity market, pairing each zone's electricity prices with the official operational text available at the corresponding forecast cutoff.
A Key Design Feature: Preventing Information Leakage
One notable design detail is that TRACE reconstructs the official operational text at each cutoff point, mechanistically preventing post-cutoff information leakage. This is a critically important yet frequently overlooked issue in time-series forecasting research. If information generated after the forecast cutoff inadvertently enters the training or evaluation process, model performance becomes severely overstated and loses real-world applicability. By strictly aligning text availability with forecast timing, TRACE ensures the authenticity and reproducibility of its evaluation results.
Validating Both Semantic Alignment and Forecasting Value
The research team evaluated TRACE along two dimensions: semantic alignment and forecasting value.
Findings at the Semantic Level
Semantic evaluation revealed that textual information aligns with central price movements as well as bilateral tail risks in actual prices. Notably, the alignment between text and upper-tail price risk was the most consistent. This means official operational text carries strong signal value for anticipating extreme high-price events — precisely the risk scenarios that electricity market participants most need to guard against.
Quantified Improvements in Forecasting Performance
In terms of actual forecasting gains, incorporating text information reduced the median upper-tail pinball loss by 7.4% across multiple time-series foundation models. Pinball loss is a standard metric for assessing probabilistic forecast quality, and this figure demonstrates that textual context delivers measurable improvements — particularly in characterizing high-price tail risk.
Pinball Loss is a core evaluation metric in probabilistic forecasting that measures the deviation between predicted quantiles and actual observations. For a given quantile τ, the loss weight is τ when the actual value exceeds the prediction, and 1−τ when it falls below. Upper-tail pinball loss specifically refers to loss at high quantiles (e.g., 90th, 95th percentile), applying heavier penalties for missed extreme high-price events and thus being more sensitive to the model's ability to forecast price spike events. Compared to point-prediction metrics such as MSE, pinball loss provides a comprehensive assessment of how well a model captures the shape of the price distribution — not just mean prediction accuracy. In electricity markets, improvements in upper-tail forecasting directly impact risk exposure management and bidding strategy formulation.
Ablation Study: Rigorous Validation of Text's Value
To confirm that the performance gains truly stem from the textual information itself rather than from incidental factors, the research team designed a controlled cross-day text-mismatch ablation experiment. When text was paired with price data from incorrect dates, the original performance gains not only disappeared — forecast performance actually fell below the baseline that used no text at all.
This result carries important methodological significance: it rules out the possibility that "text is merely acting as some form of regularization noise," and demonstrates that only when text is correctly matched with its corresponding price data can the embedded information translate into forecasting value. The reversal effect of the mismatch experiment, in turn, reinforces the authenticity of the text-price semantic relationship.
Implications for Industry and Research
TRACE's contribution extends beyond providing a new benchmark — it establishes a reproducible evaluation standard for the emerging direction of text-driven time-series forecasting. As the convergence of large language models and time-series foundation models accelerates, how to incorporate unstructured text into numerical forecasting frameworks is becoming an active research topic.
For electricity market practitioners, this research points to an actionable direction: official operational text should not be treated as optional supplementary information, but rather as an effective input for improving tail risk forecasting. Especially in risk management contexts, a 7.4% improvement in upper-tail loss can translate into substantial economic value. For the research community, TRACE's rigorous leakage-prevention design and ablation validation paradigm also provide a replicable template for future benchmark development.
Time-Series Foundation Models are general-purpose forecasting models pretrained on large-scale, multi-domain time-series data with the ability to generalize across tasks. Representative examples include TimesFM, Chronos, and Moirai. Unlike task-specific models trained for a single application, foundation models learn cross-domain temporal patterns by pretraining on thousands of series from diverse sources, enabling direct use in new settings under zero-shot or few-shot conditions. TRACE's evaluation across multiple such foundation models helps validate that text-based gains are generalizable rather than dependent on any particular model architecture. This also reflects a broader trend in forecasting research: injecting unstructured information such as text as external context into foundation models has become an important pathway for improving domain-specific forecasting accuracy.
Related articles

Chain of Thought Isn't Just for AI: How Humans Can Use CoT to Improve Thinking Quality
Chain of Thought isn't just a prompt trick for large models. Starting from a Hacker News discussion, this article analyzes why CoT works for human thinking too, breaks down actionable ways to transfer it, and highlights the key differences between human CoT and machine CoT.
Cloudflare Teams Up with OpenAI: Closi…
Cloudflare Teams Up with OpenAI: Closing the Loop from Vulnerability Discovery to Defense with AI
Cloudflare uses OpenAI Daybreak to investigate security vulnerabilities and generate reviewable remediation plans, while developers use Codex to boost coding efficiency and quality.

Orca Multi-Agent Orchestration in Practice: A Guide to Parallel Collaboration with Claude and Codex
Orca is Stable AI's free open-source agent workbench supporting 34 agents like Claude Code and Codex in parallel. Learn its Git worktree isolation, multi-model orchestration, and mobile management.