Tracing and Evaluating Hermes Agents with NVIDIA NeMo Relay and Phoenix

Use NeMo Relay and Phoenix to trace AI agent execution and visualize every tool call step by step.
The article covers NVIDIA engineer Patrick Moorhead's demo showing how NeMo Relay collects trace data and Phoenix visualizes the execution chain to achieve full observability for Hermes agents. The walkthrough follows a methodology of validating the minimal loop before expanding to real tasks — from a simple script printing 42, to a full travel-planning task involving file reading, web search, content extraction, report writing, and result verification. In Phoenix, the entire execution is presented as a turn-by-turn Span tree with every tool call's inputs, outputs, and latency on full display. The core argument: observability isn't a bonus feature but a prerequisite for taking agents from demo to production.
When an AI agent delivers an answer, what you see is usually just the end of the story. Which tools did it actually call? What did those tools return? Where did it spend most of its time? These questions are almost completely hidden in a traditional question-and-answer interaction. NVIDIA Technical Marketing Engineer Patrick Moorhead demonstrated in a walkthrough how to use NeMo Relay to trace a Hermes agent and visualize the entire execution in Phoenix — genuinely opening up the agent's "black box" for inspection.
Why Trace an Agent Instead of Just Looking at the Answer
The text an agent ultimately outputs conceals the complex decision chain behind it. It may have read local files, run multiple web searches, called content extraction tools, and even written intermediate reports. If you only look at the final conclusion, you can't judge whether the answer is reliable, let alone know where to start improving it.
Moorhead's core point is straightforward: verifying that an agent works is just the starting point. What's truly valuable is using traces to understand "what it actually did," then making changes based on evidence. This is essentially applying the mature concept of Observability from software engineering to the AI Agent development workflow. For teams building production-grade agents, this evidence-driven iteration approach is far more reliable than tuning prompts on gut instinct.
Observability originates from cybernetics and distributed systems engineering. The core idea is to infer the internal state of a system through its externally exposed outputs — logs, metrics, and traces — without modifying the system itself. In the microservices world, standards like OpenTelemetry have established the "Traces / Metrics / Logs" three pillars as the foundation of observability. Migrating this concept to AI Agents presents unique challenges: an agent's execution path is dynamically determined, and the order, frequency, and even type of tool calls can vary with input — unlike traditional services where a fixed call graph can be drawn in advance. As a result, observability for AI Agents places greater emphasis on complete recording of the "runtime trajectory," meaning every LLM inference and tool call must have a queryable snapshot of its inputs and outputs, rather than just aggregated statistical metrics.
Environment Setup: Native Integration of Hermes and NeMo Relay
The demo starts with cloning the repository and opening the Hermes Relay example. One design detail worth noting: NeMo Relay is natively integrated with Hermes during installation, requiring no separate standalone deployment. When Moorhead pulled the code from the main branch, the NeMo Relay identifier was already visible at the bottom of the terminal.
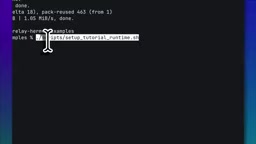
He intentionally pulled a second copy of Hermes here to isolate it from his everyday development environment and avoid interference — a practical engineering habit. The next step is configuring keys: simply fill in your NVIDIA build key in the config file, which can be obtained for free at build.NVIDIA.com.
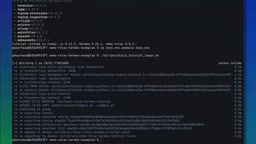
The final step is building the sandbox image, inside which Hermes executes commands. In the tutorial scenario, this sandbox is configured with no network access and no keys, making it a controlled, isolated execution environment. This sandbox mechanism is critical for allowing agents to safely run arbitrary scripts.
Hermes is an AI Agent framework from NVIDIA, designed to let agents safely execute code and tool calls within a sandboxed environment. NeMo Relay is the observability component within the NVIDIA NeMo ecosystem, responsible for intercepting and structurally recording the inputs, outputs, latency, and other metadata for every LLM call and tool call during agent runtime, then exporting these traces in an OpenTelemetry-compatible format to external analytics platforms. Phoenix is an open-source LLM observability platform by Arize AI, purpose-built for LLM applications and AI Agents. It can receive OpenTelemetry-format trace data and provides an interactive span-level visualization interface for latency analysis and input/output inspection. The division of responsibilities is clear: Hermes executes tasks, NeMo Relay collects data, and Phoenix presents and analyzes it — forming a complete "execute → record → insight" pipeline.
Starting with the Simplest Task to Validate the Pipeline
Moorhead didn't jump straight into a complex workflow. Instead, he gave Hermes a "minimum viable" task first: run a script and tell me what it prints. The expected answer was 42.
This step may seem trivial, but it reflects a sound methodology — first confirm that the entire chain (agent execution, Relay recording, result return) can run end-to-end, then gradually add complexity. After running it, the result correctly returned 42, and Relay completely recorded the execution. This "validate the minimal loop before expanding" approach is precisely what sets observability tools apart from ordinary log printing.
A Real Task: Complete Multi-Tool Orchestration
With validation complete, Moorhead introduced a task closer to a real-world scenario: a travel plan for San Diego from June 29 to July 3. Hermes needed to read the plan, run web searches, verify information on websites, then write a report and deliver an answer.
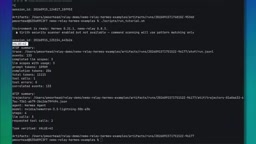
During this run, Relay exported trace data to Phoenix in real time. The execution order was: Phoenix starts first, then Hermes begins working with live searches running. This task chained together multiple tool calls — file reading, web search, content extraction, file writing, and result verification — making it an ideal specimen for testing tracing capabilities.
Unpacking the Execution Chain Step by Step in Phoenix
Opening the URL provided by Phoenix reveals the Hermes session that just ran. Clicking into it, the entire trace is presented "turn by turn," clearly showing what the agent did at each step.
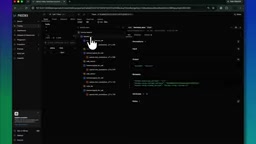
Looking at the specifics, the trace reveals: the agent first read a file (the file path and returned content are visible), then ran a web search (showing the query it wrote and the search results), followed by an additional call to a web content extraction tool, then a write-file call to generate the report, and finally a verifier reading the report and outputting the final conclusion.
The value this visualization provides is direct: you no longer need to guess what the agent "roughly did" — you can step through the input and output of every tool call. When a run produces an unsatisfactory result, the trace helps you quickly pinpoint whether the search query was poorly written, the extracted content was skewed, or something went wrong in the verification step.
The trace structure displayed in Phoenix is fundamentally a Span tree. Each Span represents a discrete operation (such as one LLM inference or one tool call) and records its start time, end time, input parameters, and return values. The "turn by turn" display corresponds to each round of the agent's "think-act" loop (in ReAct mode, this is one inference plus one tool call). By examining the Span timeline, developers can intuitively identify which tool call took the longest, whether there are redundant repeated searches, or whether a tool returned an empty result without triggering any retry logic. This level of visibility is something that simply printing the final answer or reviewing text logs cannot provide — and it's key to shortening debugging time for multi-step agents.
Observability Is the Starting Point for Agent Engineering
The real significance of this demo lies not in showcasing any single feature, but in conveying a workflow for agent development: verify it works → use traces to understand what it actually did → evaluate the next change based on evidence.
NeMo Relay handles trace collection and export; Phoenix handles visualization and analysis. Together they form the agent's "flight data recorder." As agents take on increasingly complex multi-step tasks, observability tools like these will shift from being "a nice addition" to being "absolutely essential." For AI Agent teams moving from demo to production, the chain-tracing approach Moorhead demonstrated offers a practical paradigm worth adopting. Runnable examples and more detailed instructions can be found in the corresponding GitHub repository and blog links.
Related articles

Chain of Thought Isn't Just for AI: How Humans Can Use CoT to Improve Thinking Quality
Chain of Thought isn't just a prompt trick for large models. Starting from a Hacker News discussion, this article analyzes why CoT works for human thinking too, breaks down actionable ways to transfer it, and highlights the key differences between human CoT and machine CoT.
Cloudflare Teams Up with OpenAI: Closi…
Cloudflare Teams Up with OpenAI: Closing the Loop from Vulnerability Discovery to Defense with AI
Cloudflare uses OpenAI Daybreak to investigate security vulnerabilities and generate reviewable remediation plans, while developers use Codex to boost coding efficiency and quality.

Orca Multi-Agent Orchestration in Practice: A Guide to Parallel Collaboration with Claude and Codex
Orca is Stable AI's free open-source agent workbench supporting 34 agents like Claude Code and Codex in parallel. Learn its Git worktree isolation, multi-model orchestration, and mobile management.