Tracking London's Underground in 3D Real-Time: A Technical Breakdown of an Open-Source Visualization Project

How an open-source project visualizes London Underground trains in real-time 3D using TfL's API and WebGL.
A technical breakdown of 'Follow London Trains in 3D,' an open-source project that renders the London Underground's real-time operations in three dimensions. It explores the TfL open API, position interpolation challenges, WebSocket data streaming, coordinate projection, and Three.js rendering optimizations—plus what developers can learn from it.
When Urban Transit Data Meets 3D Visualization
On Hacker News' Show HN board, a project called "Follow London Trains in 3D" caught the attention of the developer community. It's a visualization tool that renders the real-time operational status of London Underground trains in three-dimensional form.
The London Underground (commonly known as "The Tube") is the world's oldest underground railway system. It opened in 1863 and has been operating for more than 160 years. The network spans 11 lines, 272 stations, and roughly 402 kilometers in total length, with about 55% running underground. It carries around 5 million passenger journeys per day, and during weekday peak hours a train passes through core segments every 2 minutes. The network's complexity is also reflected in its layered structure—some lines run as deep as 58 meters underground (such as certain segments of the Jubilee line), and different lines use different track gauges and signaling systems. It's precisely this historical accumulation and scale of complexity that makes real-time 3D visualization both a formidable challenge and a project of high technical showcase value.
The appeal of such projects lies in transforming otherwise abstract and dull transit scheduling data into an intuitive, dynamic, and interactive visual experience. For ordinary users, it's a window into feeling the pulse of the city; for developers, it's a comprehensive exercise that combines public data APIs, real-time data stream processing, and WebGL rendering technology.
The Tech Stack Behind the Project
Data Source: The TfL Open API
Transport for London (TfL) has long provided well-developed open data interfaces. Through its unified API, developers can access multi-dimensional data including line status, station information, and train arrival predictions. Integrating these public data sources and cleaning and structuring the returned JSON is the first step for such projects.
TfL's open data initiative began around 2010 and is one of the most open examples among public transit agencies worldwide. Its unified API integrates data across multiple transport modes—Underground, buses, light rail, and bike sharing—handling over 17 million API calls per day. TfL's open data strategy has produced significant economic spillover effects—according to research it commissioned, the third-party applications built around this open data create over £130 million in value for London residents each year. This model has profoundly influenced the direction of open data policy in cities worldwide, and it's the fundamental reason TfL's interfaces frequently appear in developer projects like this one: the interfaces are well-specified, the documentation is clear, and the ecosystem is mature.
Interestingly, the TfL API often returns "predicted arrival times" rather than "precise coordinates." This means developers must infer the approximate position of trains on the track based on station locations, line topology, and arrival predictions—an engineering challenge that requires interpolation calculations.
In transit visualization, position interpolation is the core technique for converting discrete data points into continuous animation. Developers typically use linear interpolation (Lerp) or smoother spline interpolation to estimate train positions between two stations. More advanced implementations introduce easing functions to simulate the physical characteristics of train acceleration and deceleration, or use a Kalman filter to smooth noise across multiple API prediction results. Trains don't move at constant speed, and how to make trains in the 3D scene move smoothly without teleporting or jittering directly determines the visual quality of the project.
Although the TfL API primarily takes the form of traditional HTTP polling, high-quality real-time visualization projects typically introduce more efficient data transmission mechanisms between client and server. The WebSocket protocol offers significant advantages over HTTP polling: it establishes a persistent bidirectional connection, allowing the server to actively push data and eliminating the latency and bandwidth waste of polling. A typical architecture is to build a "data proxy" service on the backend: it periodically pulls the latest prediction data from the TfL REST API, performs processing such as deduplication and interpolation pre-computation, then broadcasts it via WebSocket to all connected frontend clients. This design both reduces request pressure on TfL's servers (respecting its rate limits) and allows multiple users to share the same processed data stream. Server-Sent Events (SSE) is another lightweight alternative, suitable for one-way data push scenarios.
Geographic Coordinate Systems and Projection Transformation
Mapping real-world geographic coordinates into a 3D scene is a core engineering problem that such projects cannot avoid. The geographic data TfL provides typically uses the WGS84 coordinate system (the common GPS standard), while the Ordnance Survey of Great Britain also maintains the local OSGB36/British National Grid coordinate system. On the web, developers need to convert these geographic coordinates into Three.js's local 3D coordinate space. A common approach is to select a point in central London as the origin and approximate planar distances by multiplying longitude and latitude differences by the Earth's radius (Mercator projection), while the Z axis can be used to represent height differences—for example, offsetting underground lines downward and raising elevated lines upward, thereby intuitively presenting the vertical layered structure of the London Underground network in three-dimensional space. During this conversion, distortion caused by the Earth's curvature must also be handled; over London's roughly 50-kilometer span the error remains within an acceptable range, but for global-scale visualization a more precise spherical projection model must be introduced.
Implementing 3D Rendering
Judging from the core feature of "3D," this project is very likely built on Three.js or a similar WebGL framework. WebGL (Web Graphics Library) is a browser graphics API based on the OpenGL ES standard that allows developers to directly invoke GPU hardware-accelerated rendering. However, native WebGL's programming model is extremely low-level, requiring manual management of concepts such as shaders, buffers, and textures. As the most popular WebGL wrapper library, Three.js abstracts this complexity into intuitive object models such as Scene, Camera, and Mesh, greatly lowering the barrier to entry for 3D development—its GitHub repository currently has over 100,000 stars and is the de facto standard toolkit in the Web 3D domain.
Mapping the two-dimensional line diagram of the London Underground network into three-dimensional space requires handling coordinate system conversion, camera control, and performance optimization for a large number of dynamic objects. When hundreds of trains are moving on the map simultaneously, the browser's rendering load cannot be ignored. Properly applying the following strategies is key to ensuring a smooth experience:
- Instanced Rendering: Batch-render identical geometry to dramatically reduce Draw Call overhead. In traditional rendering, each object requires its own Draw Call instruction; when there are hundreds of trains in the scene, the CPU frequently sending instructions to the GPU creates a serious performance bottleneck. Instanced rendering passes the transformation matrices (position, rotation, scale) of all instances in a single Draw Call, and the GPU processes each instance's differences in parallel, typically improving performance by more than 10x. Three.js provides native support for this technique through the InstancedMesh class.
- Frustum Culling: Render only objects within the camera's visible range.
- Data Update Throttling: Control the frequency of real-time data polling to avoid excessive redrawing.
Community Feedback on Show HN
The project earned upvotes and comment interactions on Hacker News. The Show HN board itself is an important venue for developers to showcase personal projects and get first-hand feedback—even a modest project with a well-chosen topic can spark valuable discussion.
"Urban data visualization" projects have always had a steady audience in the HN community, with similar works emerging previously such as real-time flight tracking, global ship trajectories, and real-time bus positions. These projects share common traits: a moderate technical barrier, visually appealing effects, and the public value of helping people perceive urban infrastructure.
The Multiple Values of Real-Time Transit Visualization
From a broader perspective, such projects carry multiple dimensions of significance:
- An embodiment of data democratization: Public transit data is produced by taxpayer-funded agencies, and turning it into a visualization tool that anyone can use is a direct realization of the open data philosophy.
- An excellent vehicle for technical learning: It spans multiple domains including API integration, real-time data processing, geographic information handling, and 3D graphics programming, making it an ideal practice topic for full-stack developers.
- A new dimension of urban perception: By taking a bird's-eye view of the entire city's transit network pulsing, users can understand the logic of how the city operates from a previously unattainable perspective.
It's worth noting that projects like "Follow London Trains in 3D" have a more macro-level counterpart concept in academia and industry—the Digital Twin. Digital twin technology originated in manufacturing, referring to creating an accurate digital mirror of a physical entity and keeping it in real-time synchronization. City-scale digital twins have become core infrastructure for smart city construction: Singapore's Virtual Singapore project models the city's 3D terrain and buildings at centimeter-level precision and can be used to simulate emergency response and urban planning; the "City Brain" system in Beijing's sub-center integrates transit, energy, and weather data into a unified spatiotemporal digital foundation. Compared to these national-scale projects, an individual developer's subway visualization project may differ vastly in scale, but it embodies the same core idea: mapping the dynamics of the physical world into digital space in real time, thereby enabling unprecedented insight and interaction.
Takeaways for Developers
For developers hoping to reproduce or improve on such London Underground visualization projects, the following points are worth considering.
Prioritize open APIs with high data quality and complete documentation. The reason TfL frequently appears in such projects is precisely because its interfaces are well-specified and its documentation is clear. The stability of the data source directly determines the long-term maintainability of a project.
Learn to make reasonable approximations and interpolations given that real data is imperfect. Real-world data is full of noise and gaps, and how to produce a convincing visualization from limited information often tests engineering judgment more than the technology itself.
Start small and ship fast. This project focused on a specific and interesting scenario and successfully sparked community discussion. This is exactly what the Show HN culture encourages—you don't need to pursue grand perfection; a small, well-polished project can equally win recognition.
Conclusion
"Follow London Trains in 3D" may be just one unremarkable project among many personal endeavors, but it reflects the enormous potential of combining open data, Web 3D technology, and developer creativity. As next-generation graphics technologies like WebGPU become widespread, and as more cities open up their transit data, we have every reason to look forward to more imaginative urban data visualization works, bringing cold numbers back into the public eye in more vivid ways.
WebGPU is the next-generation Web graphics and computing API standard being advanced by the W3C, intended to replace WebGL. Unlike WebGL, which is based on the OpenGL ES design from over a decade ago, WebGPU directly targets modern graphics APIs (Vulkan, Metal, Direct3D 12) and introduces compute shaders, multithreaded rendering, and more fine-grained GPU resource management mechanisms. For urban data visualization, WebGPU's compute shaders can fully offload intensive tasks such as particle simulation and path computation to the GPU, theoretically supporting the simultaneous rendering of hundreds of thousands of dynamic objects without affecting the main thread—this will lay the technical foundation for larger-scale urban digital twin visualization. Chrome officially enabled WebGPU support in 2023, and a new wave of Web 3D creation is brewing.
Key Takeaways
Related articles
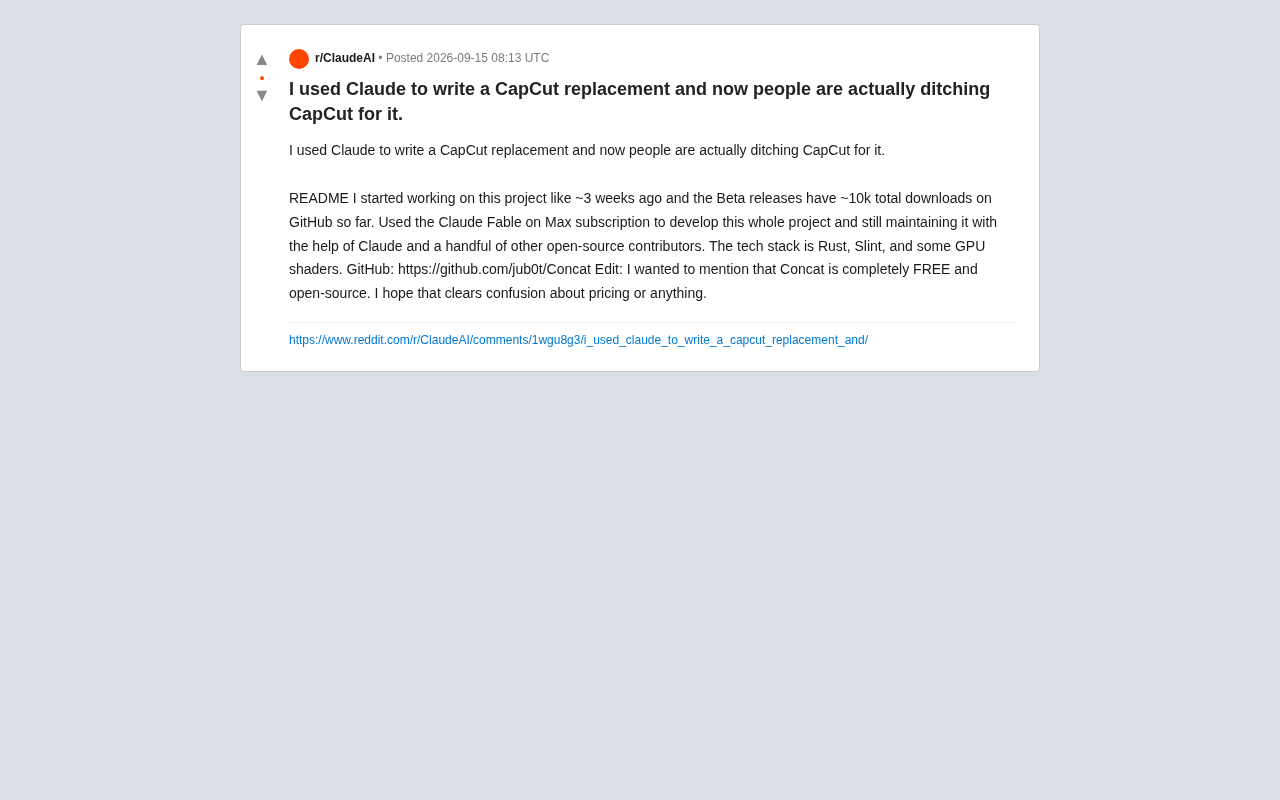
Building Open-Source Video Editor Concat with Claude: A Free Alternative to CapCut
A developer used Claude to build Concat, an open-source CapCut alternative, in just three weeks. With nearly 10K downloads, it's a striking example of AI-assisted solo development.
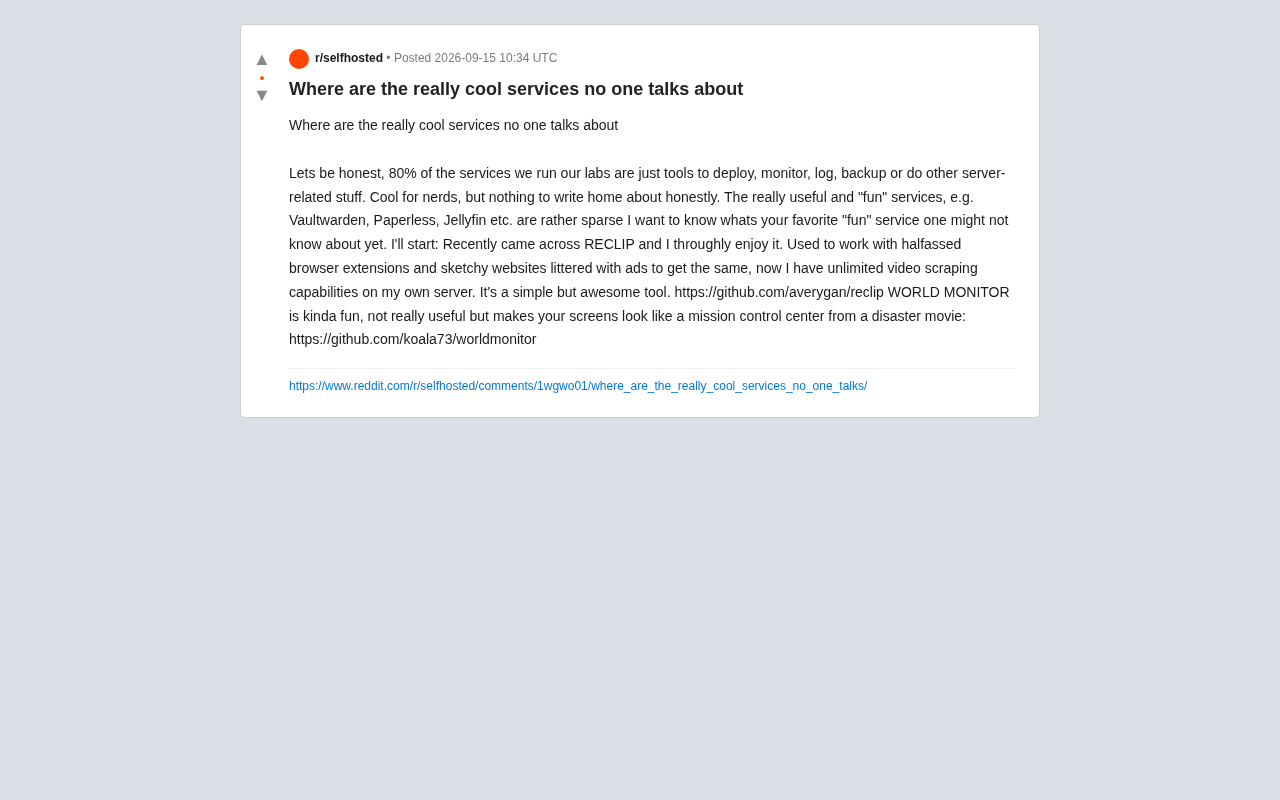
The Overlooked Gems of Self-Hosting: Fun and Useful Services Nobody Talks About
From a Reddit thread, we explore overlooked self-hosted services — including video scraper RECLIP and data viz project WORLD MONITOR — and why fun services are so rare.
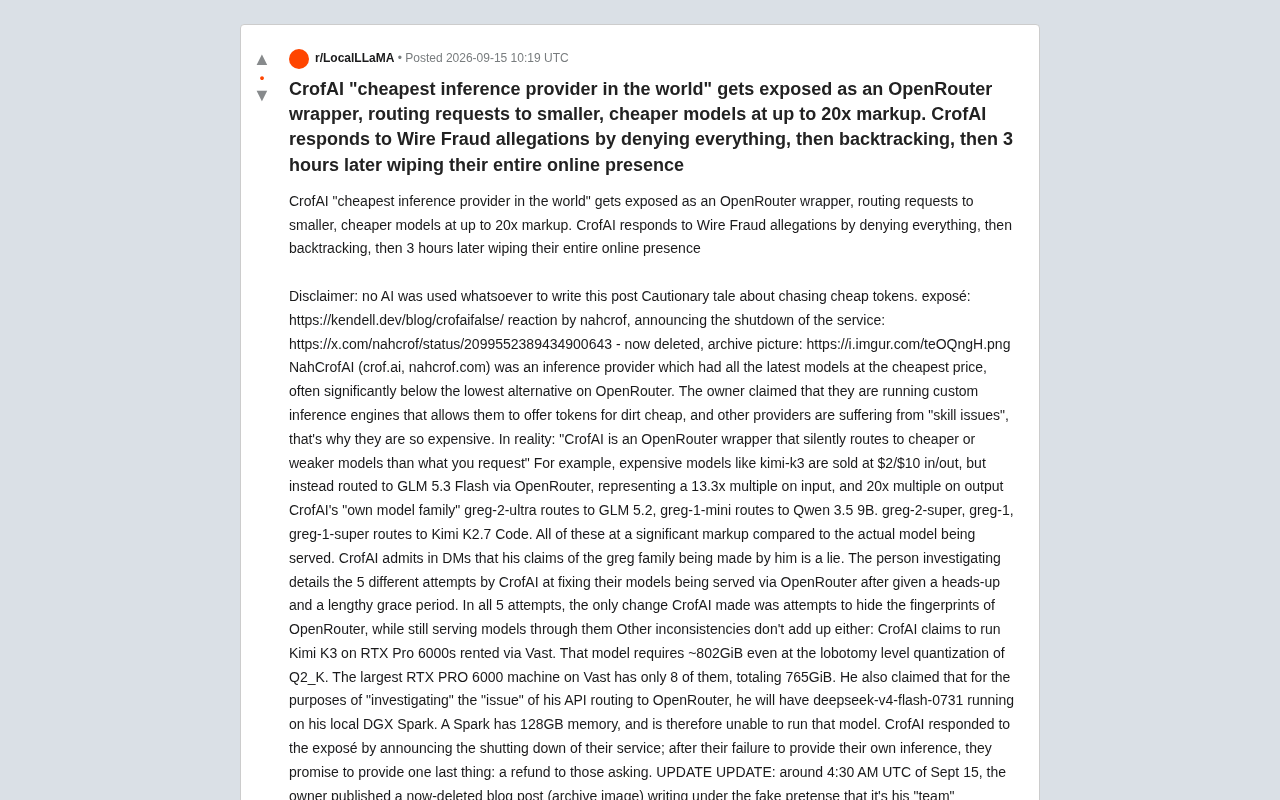
CrofAI Fraud Exposed: 'World's Cheapest AI Inference' Turns Out to Be an OpenRouter Wrapper Scam
CrofAI claimed to offer the world's cheapest AI inference, but was exposed as an OpenRouter wrapper silently rerouting requests to cheap models at up to 20x markups.