Validating Neural Network Default Models: Practical Techniques Beyond AUC and KS

Neural network default models need more than AUC/KS: calibration, stability, attribution, and fairness validation.
This article addresses neural network probability of default (PD) models, noting that traditional metrics like AUC, KS, and GINI only measure discrimination and cannot assess calibration quality, stability, or fairness. It systematically reviews validation techniques beyond standard metrics: calibration curves and Brier scores, ranking stability (PSI, DeLong test), feature attribution (SHAP, permutation importance), and stress testing. For fairness, it proposes a closed-loop framework from data representativeness to outcome metrics (demographic parity, equal opportunity, predictive parity) to continuous monitoring, emphasizing that trade-offs must be documented. It concludes by recommending a three-level validation system—statistical, behavioral, and governance—with clear thresholds and review triggers to shift validation from one-time reporting to continuous governance.
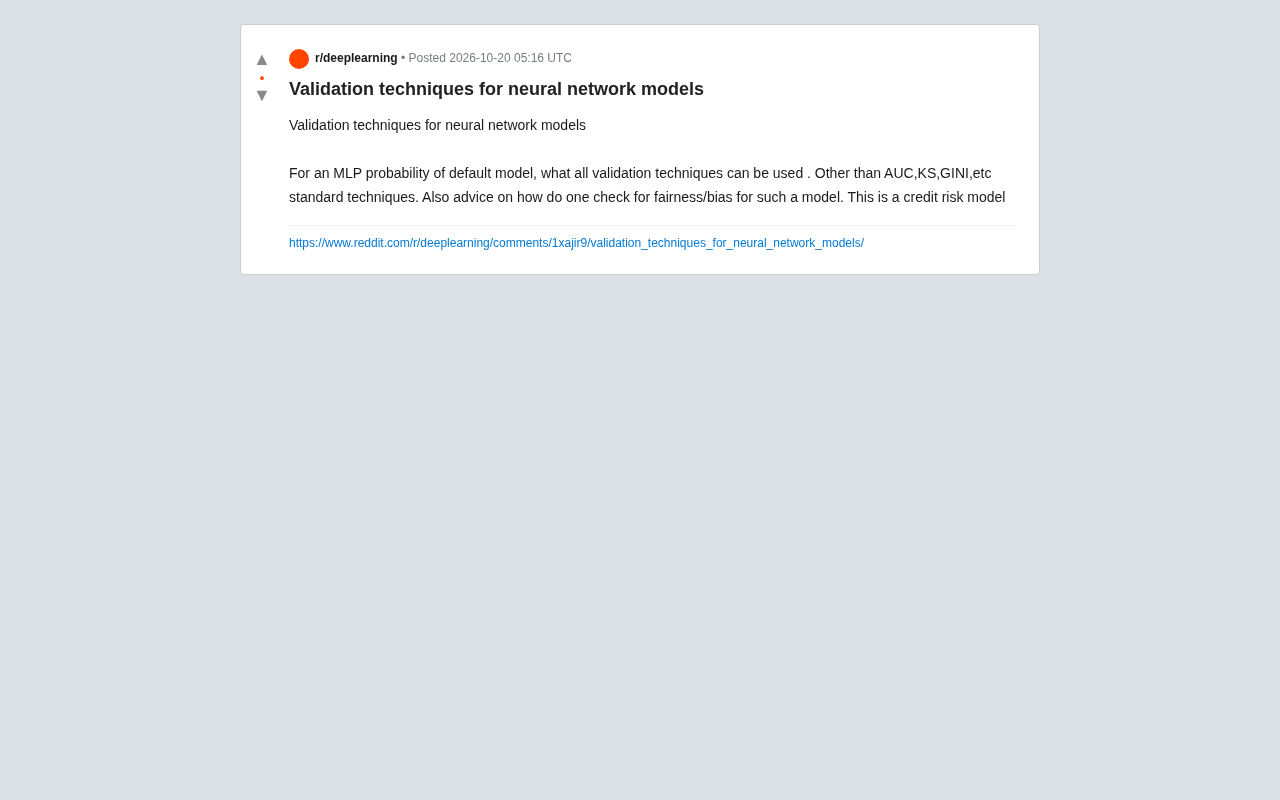
In credit risk, neural network models such as multi-layer perceptrons (MLPs) are gradually replacing traditional scorecards. But many practitioners find that metrics like AUC, KS, and GINI alone are insufficient to fully assess a model's robustness and fairness. A Reddit user posed a typical question about probability of default (PD) models: beyond standard metrics, what validation techniques exist? How can fairness and bias be checked? This article, based on that discussion and combined with industry practice, lays out an actionable validation framework.
Why Standard Metrics Fall Short
AUC measures ranking ability, KS focuses on discrimination, and GINI is linearly related to AUC. These metrics are indeed necessary during model development, but they cannot answer several key questions: How stable is the model across different time periods? Are the predicted probabilities calibrated? Is there systematic bias against certain customer segments?
For PD models, calibration quality directly affects expected loss calculations. A model with high AUC but poor probability calibration can distort provisioning. In addition, regulatory requirements for model interpretability and fairness are becoming increasingly stringent, and discrimination metrics alone are hard-pressed to meet compliance needs.
Validation Techniques Beyond AUC/KS
Probability Calibration and Brier Score
A calibration curve bins predicted probabilities and compares them with actual default rates, visually showing whether the model overestimates or underestimates risk. The Brier score combines calibration and discrimination into a single metric for assessing the quality of probability forecasts. For PD models, it is recommended to report both the intercept and slope of the calibration curve, as well as the decomposition of the Brier score.
Calibration slope and intercept: The intercept of the calibration curve reflects whether the model overall overestimates or underestimates risk (ideal value 0), while the slope reflects whether the spread of predicted probabilities is appropriate (ideal value 1). If the slope is less than 1, the model's predictions are too extreme (overestimating high risk, underestimating low risk); if the slope is greater than 1, predictions are too conservative. These two parameters are typically estimated by fitting a logistic regression of actual default rates on the logit of predicted PDs.
Decomposition of the Brier score: The Brier score can be decomposed into reliability (calibration), resolution (discrimination), and uncertainty. Reliability measures the deviation of predicted probabilities from true frequencies, while resolution measures the model's ability to distinguish different default rates. This decomposition helps pinpoint the source of problems—whether poor calibration or insufficient discrimination.
Ranking Stability Beyond Discrimination
Ranking stability can be monitored through the population stability index (PSI) to track score distribution drift, but PSI is sensitive to binning. A more robust approach is to compute confidence intervals for AUC across different time windows, or to use the DeLong test to compare AUC differences between subpopulations. If AUC drops significantly on recent samples, concept drift should be investigated.
DeLong test: The DeLong test is a non-parametric statistical method for comparing whether the difference between the areas under two correlated ROC curves (AUC) is significant. It accounts for the correlation between predictions of two models on the same dataset and is suitable for comparing AUC differences between subpopulations or model performance across time windows. In credit risk validation, it can be used to test whether an AUC decline on recent samples is statistically significant, avoiding misjudging model degradation due to sampling fluctuation.
Feature Importance and Attribution Consistency
The black-box nature of neural networks is often questioned. SHAP values can provide local and global attributions, but their computational cost and sampling variance must be noted. Alternatives include permutation importance and gradient-based saliency maps. The key is to cross-validate with business logic: if a feature that should theoretically be important (such as debt-to-income ratio) ranks very low in attribution, feature engineering or model structure should be examined.
Sampling variance of SHAP values: SHAP (SHapley Additive exPlanations) is based on Shapley values from cooperative game theory and provides an additive decomposition of feature contributions for each prediction. For neural networks, exact computation of Shapley values has exponential complexity, so sampling approximations (such as KernelSHAP) are commonly used. Insufficient sampling leads to unstable attribution results, manifesting as fluctuations in feature rankings across runs. It is recommended to increase the number of samples or use gradient-based DeepSHAP, and to report confidence intervals for attributions.
Permutation importance and gradient saliency: Permutation importance measures importance by randomly shuffling a feature's values and observing the resulting drop in model performance. It is simple to compute but may underestimate the importance of correlated features. Gradient-based saliency maps (such as Integrated Gradients) can provide local explanations, but gradient saturation issues should be noted.
Stress Testing and Scenario Analysis
Regulatory stress testing requires models to maintain reasonable ranking under extreme scenarios. Macroeconomic shock scenarios (such as a doubling of the unemployment rate) can be designed to observe whether changes in the model's output PD distribution align with expectations. If ranking ability deteriorates sharply under stress scenarios, it suggests that the model's capture of nonlinear relationships may be overfitted.
Fairness and Bias Checks
Fairness checks for credit risk models should start from three levels: data, model, and outcomes.
Representativeness at the Data Level
Examine the sample sizes and default rate distributions of each protected group (such as age, gender, region) in the training data. If a group has too few samples, the model may underfit. Also beware of proxy variables: postal codes may implicitly encode racial information, and even if the model does not directly use protected features, indirect discrimination may arise through proxy variables.
Fairness Metrics at the Outcome Level
Commonly used fairness metrics include:
- Demographic Parity: Approval rates or high-PD proportions should be similar across groups, but this metric may be too stringent in credit risk because true default rates may differ between groups.
- Equal Opportunity: Among true default samples, the rate at which each group is correctly identified as high risk should be similar.
- Predictive Parity: Within the same PD prediction interval, actual default rates should be similar across groups.
In practice, predictive parity and equal opportunity often involve trade-offs. It is recommended to choose a primary metric based on the business scenario and document the rationale for the trade-off for audit purposes.
Mathematical trade-offs among fairness metrics: Demographic parity, equal opportunity, and predictive parity often cannot be satisfied simultaneously mathematically (unless true default rates are identical across groups and the model is perfect). For example, when true default rates differ between groups, enforcing demographic parity distorts predicted probabilities and harms calibration, while pursuing predictive parity may accept group differences in approval rates. This trade-off is central to the fairness discussion in credit risk, and regulators typically require institutions to explicitly choose a primary metric and document the rationale.
Continuous Monitoring and Fairness Audits
Fairness is not a one-time check. After deployment, PD distributions and approval rates should be monitored periodically by group slice. If a group's approval rate consistently falls below the benchmark, a model review should be triggered. A fairness dashboard can be established to bind statistical parity differences to business thresholds for automated alerts.
Building a Multi-Level Validation System
No single technique can cover all risks. It is recommended to divide validation into three levels:
- Statistical level: AUC, KS, calibration, Brier, PSI, covering discrimination, calibration, and stability.
- Behavioral level: SHAP attributions, partial dependence plots, stress testing, examining model logic and business consistency.
- Governance level: Fairness metrics, group slice monitoring, documented trade-off decisions, meeting compliance and ethical requirements.
Each level should have clear pass criteria and review trigger conditions. For example, recalibration is triggered when the calibration slope deviates from 1 by more than 0.2; a dedicated fairness analysis is initiated when the equal opportunity difference exceeds 5 percentage points.
Conclusion
Validation of neural network default models goes far beyond AUC and KS. Calibration curves, Brier scores, ranking stability, SHAP attributions, and stress testing together form an evidence chain at the statistical and behavioral levels. Fairness checks require a closed loop from data representativeness to outcome metrics to continuous monitoring. For highly regulated scenarios such as credit risk, it is recommended to document the validation framework and clearly define thresholds and response processes for each metric, transforming model validation from a "one-time report" into "continuous governance."
One-line Summary
Neural network default models need to go beyond AUC/KS and add calibration, stability, attribution, and fairness validation.
Paragraph Summary
This article addresses neural network probability of default (PD) models, pointing out that traditional metrics such as AUC, KS, and GINI only measure discrimination and cannot assess calibration quality, stability, or fairness. It systematically reviews validation techniques beyond standard metrics: probability calibration curves and Brier scores, ranking stability (PSI, DeLong test), feature attribution (SHAP, permutation importance), and stress testing. On fairness, it proposes a closed-loop framework from data representativeness to outcome metrics (demographic parity, equal opportunity, predictive parity) to continuous monitoring, and emphasizes that trade-offs between metrics must be documented. Finally, it recommends building a three-level validation system—statistical, behavioral, and governance—with clear thresholds and review trigger conditions, transforming model validation from a one-time report into continuous governance.
Related articles

Huberman's Rational Supplement Guide: A Five-Layer Health Framework and Scientific Decision-Making
Stanford neurobiology professor Huberman proposes a rational supplement framework: behavior and nutrition are the foundation, basic combination supplements serve as insurance, and sleep/hormonal/cognitive directions should stick to single-ingredient experiments. Omega-3 is the top single-ingredient choice, and melatonin is not recommended.

The Unsung Painter Behind Gilded Age Manhattan Interior Design
HN discussion highlights the painter behind Gilded Age Manhattan interiors: he created murals and decorative paintings but was long overlooked as his work was seen as architectural appendage.

Can AI Agents Be Socially Engineered? Understanding Prompt Injection and Tool Permission Risks
Through Invariant Lab's GitHub Issue injection and Brave's AI browser attack, this article analyzes how Prompt Injection induces AI Agents to perform unauthorized actions, and offers protection advice across three layers: least privilege, tool validation, and operation auditing.