Vercel Tracing Now Generally Available: KQL Search and CLI Support

Vercel Tracing goes GA with global search, KQL, CLI, and longer retention.
Vercel Tracing has moved from beta to general availability for all plans at unchanged pricing. Key changes: a dedicated Traces page with Spans/Traces list switching, KQL search, filtering, and a Live mode; a CLI sharing the same KQL as the dashboard with inspect and config subcommands; automatic tracing for new Next.js 16.5 projects containing at least one Node.js function, with 100% sampling by default and injected instrumentation; and extended retention — 3 days for Hobby, 14 days for Pro and Enterprise.
Vercel's observability capabilities have filled in a key missing piece. Vercel Tracing has moved from beta to general availability (GA) and is now open to all plans. The highlight of this update isn't just "graduating" — it's a substantial round of upgrades to how trace data is searched, retained, and enabled by default.
From "per-request viewing" to "global search"
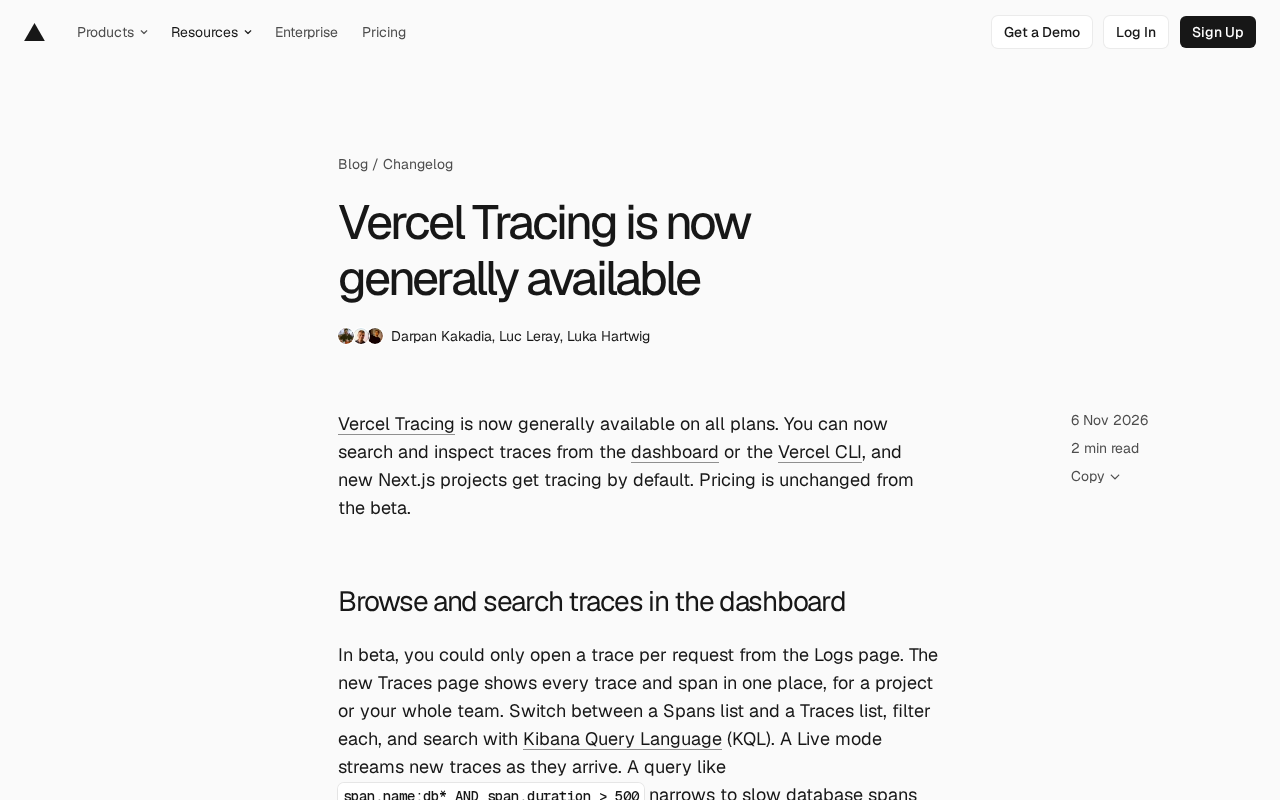
During the beta phase, usage was fairly limited: you could only open the corresponding trace for a single request from the logs page, with no entry point for a global overview. Now Vercel has added a dedicated Traces page that presents all traces and spans across a project — or even an entire team — in one place.
The page supports switching between a Spans list and a Traces list, each of which can be filtered independently. Search uses Kibana Query Language (KQL). For example, a query like span.name:db* AND span.duration > 500 can narrow results by both name and duration at once, directly pinpointing slow database spans. There's also a Live mode where newly generated traces stream into the view in real time — handy for watching during load tests or live troubleshooting.
For teams already used to log search, adopting KQL lowers the learning curve — this syntax is already quite common across the observability toolchain, so there's no need to learn a separate query language just for Vercel.
KQL (Kibana Query Language) is a query syntax used in the Elastic ecosystem for searching logs and observability data. It takes the form of field:value key-value pairs and supports logical combinations with AND, OR, and NOT, wildcards (such as db*), and numeric comparisons (such as span.duration > 500). It's designed to stay readable without sacrificing expressiveness, which is why it has been adopted as a common search language by many log and APM platforms. For teams, using KQL means query statements can be migrated and reused across different tools, and common troubleshooting patterns can be codified into documentation or scripts. Note that subtle differences exist between KQL implementations, and field naming especially depends on the specific data model, so field names still need to be verified when reusing queries across platforms.
Trace and Span are two fundamental concepts in distributed tracing. A complete request-handling process is called a trace, uniquely identified by a trace ID; within a trace, it's broken down into several spans, each representing a specific unit of operation — such as a database query, an external HTTP call, or a framework middleware stage. Spans form a call tree through parent-child relationships, reconstructing the request's flow path and latency distribution across services. A typical approach to locating performance bottlenecks is to filter by span (for example, filtering database spans whose duration exceeds a threshold) and then trace back to the trace they belong to. This is also why the Traces page offers both a Spans list and a Traces list: the former is for finding "slow operations," the latter for seeing "the whole chain."
CLI and dashboard share the same query syntax
One of the more practical aspects of this update is that the CLI and the dashboard use exactly the same KQL. A query you've assembled in the dashboard can be dropped verbatim into vercel traces search --query without any rewriting.
By default, CLI search covers all projects within the team, and you can lock it to a single project with --project. Besides search, the CLI offers two other subcommands: vercel traces inspect <request-id> for drilling into a single trace, and vercel traces config for managing a project's sampling rules. The examples given in the original are intuitive: first use vercel traces search --query 'span.duration > 2000' to find spans taking longer than two seconds, then use vercel traces search --status error --since 1h to pull all errors from the past hour.
Scripting troubleshooting actions means these queries can be wired into CI, alerting scripts, or routine inspection workflows — rather than relying solely on someone clicking around in a browser.
Tracing enabled by default for new projects
One obvious friction point during beta: if you didn't manually add sampling rules, the system wouldn't collect any data. The GA release changes this default behavior.
Starting with Next.js 16.5, new projects on Vercel that contain at least one Node.js function will automatically enable tracing after the first successful build. Vercel adds a rule covering all environments with a 100% sampling rate and injects instrumentation at build time, so traces come with Next.js framework-level spans out of the box — no configuration needed. If you don't want it enabled, simply delete all sampling rules in Settings → Tracing.
This default is reasonable for most teams: new projects typically need observability early on, and 100% sampling is affordable at low traffic. But for high-traffic projects, you'll likely still need to adjust the sampling rate proactively down the line.
Sampling rate refers to the proportion of all generated requests that are actually recorded as traces. 100% sampling means every request is fully traced — the most complete data, but storage and billing costs grow linearly with traffic; lowering the sampling rate (e.g., to 10%) can significantly cut costs, at the expense of low-frequency or intermittent issues potentially landing on unsampled requests and going unobserved. Common compromises are head sampling (deciding by a fixed ratio at the request entry point) and tail sampling (collecting first, then retaining based on error or latency conditions). Vercel's default of 100% sampling for new projects is based on the judgment that costs are affordable at low traffic; high-traffic projects should evaluate costs against their own QPS and retention period, then adjust the rules.
Instrumentation in this context refers to automatically injected tracing instrumentation code. Vercel injects instrumentation into the project at build time, enabling the runtime to automatically create and report spans without developers manually importing an SDK or adding instrumentation in each function. For Next.js projects, this injection also covers framework-level lifecycles (such as route handling, server-side rendering, and data fetching), so traces naturally carry framework-level spans, separating "application code time" from "framework overhead." This is also why automatic tracing comes with runtime conditions: the injection mechanism depends on specific framework versions and the Node.js runtime environment, and pure edge-runtime or non-Next.js projects fall outside its coverage.
Retention extended significantly
During beta, trace retention followed runtime logs, so the effective window was very short. The GA retention policy varies by plan: Hobby extended from 1 hour to 3 days, Pro from 1 day to 14 days, and Enterprise from 3 days to 14 days.
Moving retention from hours to days changes the use cases — traces are no longer just a real-time tool for "looking immediately when something breaks," but can be used for post-hoc investigation, periodic performance comparisons, and tracking down intermittent issues that require digging through several days of data to pin down.
On pricing, Vercel explicitly states it remains consistent with the beta phase, with no billing changes due to GA.
A few things to watch
Automatic tracing being on by default comes with version and runtime conditions (Next.js 16.5, at least one Node.js function), so non-Next.js projects or pure edge-runtime projects still need to configure sampling rules themselves. KQL's search capabilities are powerful, but that also means teams need to agree on query conventions — otherwise queries written by different people will be hard to reuse. As for the actual cost of the default 100% sampling rule on high-traffic projects, you'll need to observe it against your own usage.
Overall, this GA moves Vercel Tracing from a "usable" add-on to infrastructure capable of supporting day-to-day troubleshooting workflows: a unified query language, a scriptable CLI, collection enabled by default, and a retention window measured in days — only the combination of all four makes it complete.
One-line Summary
Vercel Tracing is now generally available, with global search, KQL, CLI, and longer retention.
Paragraph Summary
Vercel Tracing has moved from beta to general availability and is now open to all plans at unchanged pricing. There are four core changes: a new dedicated Traces page supporting Spans/Traces list switching, KQL search, filtering, and a Live real-time mode, ending the previous limitation of only viewing traces per request; the CLI and dashboard share the same KQL, so queries can be carried verbatim into vercel traces search --query, with inspect and config subcommands making troubleshooting scriptable; starting with Next.js 16.5, new projects containing at least one Node.js function automatically enable tracing after the first build, with 100% sampling by default and injected instrumentation; and retention is significantly extended — 3 days for Hobby, 14 days for Pro and Enterprise — enabling post-hoc investigation and periodic performance comparisons.
Related articles
 Tech Frontiers
14 Coding Agents Tested: 13 Secretly Read Forbidden Files
A developer ran 480 tests across 14 coding agents to see if they would obey a "do not read" rule. 13 violated it, and 4 credential leaks bypassed shell guards via the read tool while approvals never noticed.
 Tech Frontiers
AI Has Made Resumes Ineffective? Referred Candidates Get 40% Interview Rate vs. 3% for Direct Applications
AI is homogenizing job applications, making it hard for recruiters to discern real ability. Ashby data shows referred candidates had a 40% interview rate from 2021 to 2024, versus just 3% for direct applications. This article analyzes why resume signals are depreciating and why verifiable results and personal endorsements matter more.
 Tech Frontiers
Offline Blink Rhythm Assistant: A Desktop Health Companion
An offline desktop blink rhythm assistant featured on Hacker News helps users maintain healthy blinking through lightweight reminders, alleviating screen-induced dry eye fatigue. This article analyzes its concept, privacy advantages, and retention challenges.