Visual-Code Diagnostics: Test-Time Refinement Makes Chart Code Generation More Accurate
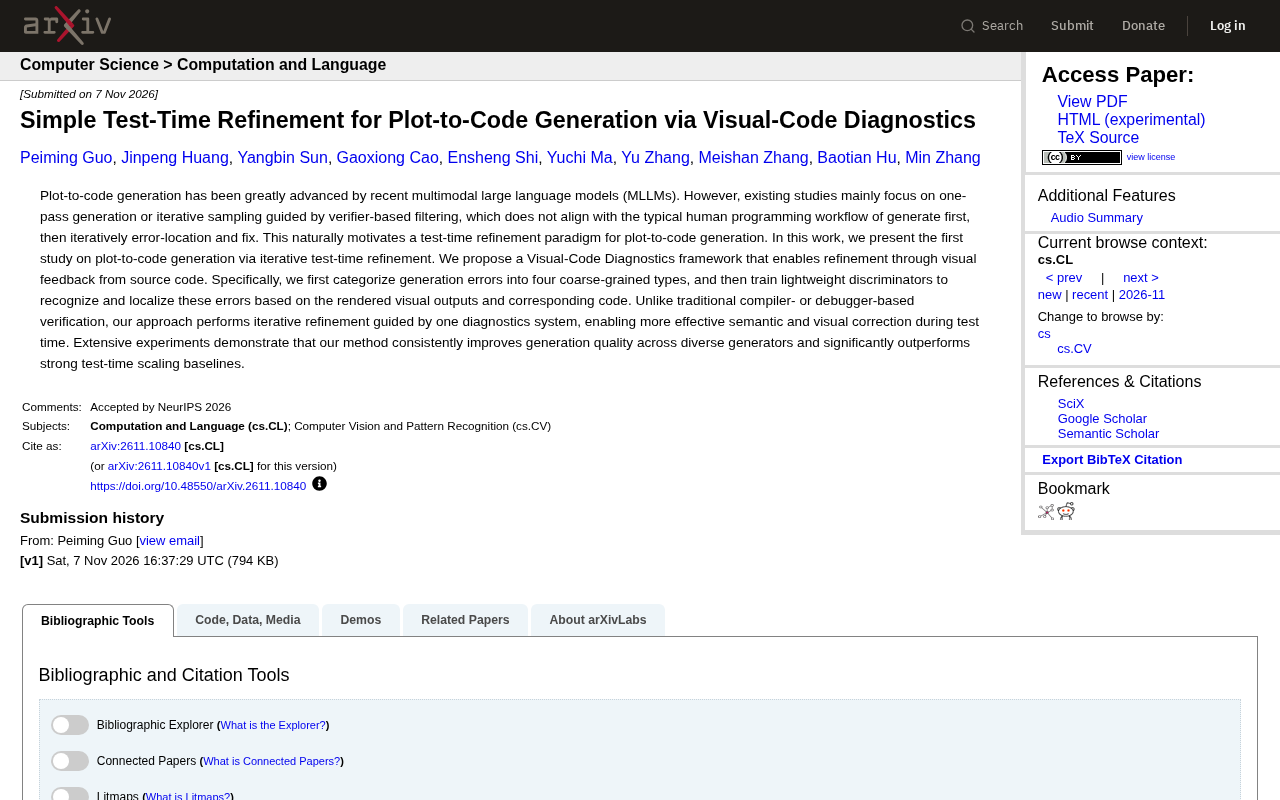
Proposes Visual-Code Diagnostics, using visual feedback to diagnose errors and iteratively repair chart code, outperforming sampling-filter baselines.
This study is the first to systematically explore test-time refinement for chart code generation and proposes the Visual-Code Diagnostics framework. To address the shortcomings of existing methods—"one-shot generation" or "verifier selection—the framework first categorizes common errors into four types, trains lightweight discriminators to identify error type and location based on rendered visual output and code, and then uses a "diagnose-repair" loop to guide the generator in targeted code modifications. Experiments show the method consistently improves quality across different generators and significantly outperforms strong test-time scaling baselines. Its core advantage is specific feedback—not just good or bad, but where and what type of error—making corrections more targeted. The article also notes limitations such as coarse error taxonomy and unclear cross-domain generalization of the discriminator.
From One-Shot Generation to Iterative Repair: A New Paradigm for Chart Code Generation
Current multimodal large language models (MLLMs) have made significant progress on chart-to-code generation tasks, but mainstream approaches still rely on "one-shot generation" or "iterative sampling filtered by verifiers." This paradigm is inconsistent with how human programmers work: write code, identify errors, and fix them. A recent study on arXiv is the first to systematically explore test-time refinement for chart code generation, proposing the Visual-Code Diagnostics framework, which uses visual feedback to guide iterative code correction.
The motivation is straightforward: humans rarely write code correctly on the first try; they run it, observe the output, locate problems, and modify the code. Existing methods either generate only once or rely on external verifiers to score and select among multiple samples, lacking fine-grained error localization and targeted repair. Visual-Code Diagnostics aims to fill this gap.
Test-time Refinement refers to investing additional computational resources during model inference (rather than training) to make multiple rounds of modifications to the initial output to improve quality. It is closely related to but distinct from Test-time Scaling: the latter typically improves performance by increasing sampling counts, generating multiple candidates in parallel, and using verifiers to select the best—essentially "cast a wide net and pick the best"; while refinement emphasizes targeted correction of a single output—essentially "polish step by step." This idea draws on how human programmers debug code: run, observe, locate, modify, and repeat. In chart code generation, because the code may be syntactically correct but the rendered result may be visually wrong, refinement must rely on visual feedback rather than compiler errors alone, making the design of the diagnostic module critical.
Error Taxonomy and Lightweight Discriminators: Making Diagnosis Evidence-Based
The first step of the framework is coarse-grained classification of generation errors. The researchers categorize common errors in chart code generation into four types, covering typical semantic and visual deviations. This taxonomy is not merely theoretical; it provides actionable targets for subsequent automatic diagnosis.
Based on these four error types, the team trained lightweight discriminators. These discriminators take the rendered visual output and the corresponding code as input, identify the error type, and localize the problem. Unlike traditional compiler or debugger validation, the discriminators do not depend on whether the code runs; they focus on whether the result "looks right"—which is precisely the core of chart generation: cases where the code is syntactically correct but the visualization is wrong are very common.
The lightweight discriminator design means the diagnostic process itself incurs low computational overhead, making iterative refinement feasible at test time.
Discriminator here refers to an independently trained lightweight classification model used to determine which error type the generated code and its rendered result belong to, or whether it is acceptable. Unlike the generator (the large model responsible for producing code), the discriminator has few parameters and low inference cost, so it can be called multiple times at test time without significantly increasing latency. In Generative Adversarial Networks (GANs), discriminators distinguish real from fake samples; in this framework, it is used as a "diagnostic tool": input is the rendered chart image and the corresponding code, output is the error category label and possibly location information. This design turns the feedback signal in iterative refinement from a single "good/bad" score into a structured error description, providing a basis for subsequent targeted repair. Lightweighting also ensures the computational feasibility of multiple iterations.
Iterative Refinement: Driving Semantic Corrections with Visual Feedback
After obtaining the diagnostic results, the framework enters the iterative refinement stage. In each iteration, the system uses the error type and location identified by the discriminator to guide the generator in making targeted modifications to the code. This process can be repeated multiple times until the diagnostic system no longer reports significant errors or a preset iteration limit is reached.
Compared with test-time scaling methods that rely on external verifier scores, the advantage of this "diagnose-repair" loop is that the feedback signal is more specific. Verifiers typically only give a "good" or "bad" judgment, whereas Visual-Code Diagnostics can tell the model "where it went wrong and which category the error belongs to," making corrections more targeted. The researchers emphasize that this method achieves more effective correction at both semantic and visual levels.
Test-time Scaling is a class of strategies commonly used in recent large-model inference. The core idea is to improve output quality by increasing inference-time computation without updating model parameters. Common approaches include multiple sampling and voting, generating multiple candidates and ranking them with a verifier, or having the model self-reflect and rewrite. In code generation tasks, verifiers are usually based on unit test pass rates or manually designed heuristics. However, such methods have two limitations: first, verifiers often provide only scalar scores, lacking specific error localization; second, the gains from increased sampling quickly saturate. Visual-Code Diagnostics differs in that it replaces "sample-select" with a "diagnose-repair" loop, spending computation on targeted corrections rather than blindly expanding the candidate set.
Experimental Performance: Consistent Gains Across Generators
The paper conducts extensive experiments with two core conclusions. First, the method consistently improves generation quality across different generators, indicating that the diagnostic and refinement modules have some generality and do not depend on a specific model architecture. Second, it significantly outperforms other strong test-time scaling baselines. This shows that for tasks like chart code generation that highly depend on visual fidelity, fine-grained diagnosis is more effective than simply increasing sampling counts or relying on verifier selection.
One detail: this study is the first work on iterative test-time refinement for chart code generation, and its framework design offers a reusable approach for future research: combining error taxonomy, lightweight discrimination, and iterative repair into a closed loop.
Significance and Limitations
The value of this work lies in shifting "test-time computation" from simple sampling expansion to structured error localization and repair, which is closer to real programming scenarios. For chart generation applications requiring high visual accuracy, this refinement mechanism could reduce manual inspection costs.
However, the current error taxonomy is still coarse-grained; whether the four error types cover all practical deviations remains to be further verified. The discriminator's training relies on annotated data, and its cross-domain generalization ability is unclear. In addition, the trade-off between iteration count and gains needs to be balanced in real deployment. Nevertheless, this study opens a new path for test-time optimization of chart code generation, and future extensions to more complex chart types and interactive programming scenarios are worth watching.
Related articles

Why Git Is Essential in the AI Era: From Version Control to Agent Collaboration
What's the difference between Git and GitHub? How do you manage changes with Issues, branches, and Pull Requests after AI Agents write code? Based on NetworkChuck's Git tutorial, this article walks through the complete flow from git init to conflict resolution and analyzes why version control has become an essential skill in the AI era.
OpenAI 6.2 Astra Hands-On Review Gone Wrong: Impressive Benchmarks, But Developers Say It's Unusable
OpenAI 6.2 Astra leads benchmarks at lower cost, but early testers report frequent stalls in long tasks, unparseable output, and uncontrolled resource management. We examine the gap between real-world experience and official data, and what it means for developer adoption.

GTA VI Coffee System Details Revealed: Hot Coffee Can Be Splashed on People?
Vergecast podcast reveals GTA VI's coffee system: players can brew in apartments, buy from vending machines, order in restaurants, and even splash hot coffee on others. This detailed recreation of daily interactions continues Red Dead Redemption 2's immersive design and sparks discussion on game detail versus gameplay balance.