Visualizing Reinforcement Learning: How a 3-Parameter Agent Learns to Seek Reward and Avoid Harm
A viral Reddit project visualizes reinforcement learning with a 3-parameter approach-avoid agent, making learning dynamics visible.
*Watch a Brain Learn* is a visualization project that demonstrates reinforcement learning with an approach-avoid agent containing only 3 parameters: approach tendency, avoidance tendency, and exploration level, fine-tuned after each interaction. By minimizing parameters, every update becomes traceable, turning credit assignment from a black box into a visible arrow. The approach-avoid paradigm naturally embodies the exploration-exploitation tension, and the visualization emphasizes behavioral trajectories rather than final policies, helping explain exploration decay and local optima. Positioned for teaching and science communication, it cannot represent deep RL complexity but offers a low-barrier intuitive entry point and reflects community demand for explainable learning processes.
Reinforcement learning is often described as "learning by trial and error," but abstract formulas often make it hard for beginners to build intuition. A visualization project recently trending on Reddit, Watch a Brain Learn, offers a more intuitive path: using an approach-avoid agent with only 3 parameters, it "draws" the learning process so observers can see with their own eyes how a policy moves from random wavering to stable decision-making.
Starting from 3 Parameters: The Design Logic of a Minimalist Agent
The core insight of this project is that understanding reinforcement learning doesn't have to start with deep neural networks. The agent built by the author maintains only 3 adjustable parameters, corresponding to approach tendency, avoidance tendency, and the degree of exploration when interacting with the environment. In each round of interaction, the agent chooses to "approach" or "avoid" a stimulus based on its current parameters, and then fine-tunes the parameters based on the outcome.
The number of parameters is deliberately kept to a minimum so that every update can be tracked visually. Viewers can clearly see how, after a parameter is increased, the agent's behavior shifts the next time it encounters a similar situation. This "less is more" design turns the most critical problem in reinforcement learning—the credit assignment problem, i.e., which parameter should be responsible for the outcome—from a black box into a visible arrow.
The credit assignment problem is one of the core challenges in reinforcement learning: when an agent takes a series of actions and obtains a certain outcome (reward or punishment), how do we determine which action and which internal parameter should be responsible for that outcome? In deep reinforcement learning, this problem is especially tricky because the network contains millions of parameters, and gradient signals must pass through multiple layers of nonlinear transformations to trace back to specific weights. In this project's 3-parameter agent, credit assignment is simplified to the extreme—the causal chain between each parameter and the behavioral outcome is short and transparent, and viewers can directly observe the complete loop: "increase the approach parameter → tend to approach more next time → receive reward → continue increasing that parameter." This transparency is precisely the pedagogical value of the minimalist design: it turns the hardest-to-intuit credit assignment problem in reinforcement learning into an arrow that can be tracked by the naked eye.
The Approach-Avoid Paradigm: A Classic Framework for Behavioral Learning
Approach-avoid is a classic paradigm in behavioral psychology: organisms produce approach responses to rewarding stimuli and avoidance responses to punishing stimuli. The project transplants this framework onto an artificial agent, so that when facing different stimuli it must trade off between "obtaining reward" and "avoiding risk."
The value of this setup is that it naturally contains the tension between exploration and exploitation. If the agent only ever approaches, it may run into punishment; if it avoids too much, it will miss rewards. The 3 parameters correspond exactly to a few key knobs in this tension, and the learning process is the process of gradually turning these knobs to the right positions. Visualization translates this trade-off from mathematical language into behavioral language.
The exploration-exploitation dilemma is a fundamental tension in reinforcement learning: the agent must trade off between "trying new actions to gain more information" (exploration) and "choosing the known best action to maximize immediate return" (exploitation). Excessive exploration leads to low efficiency and frequent missteps; excessive exploitation may trap the agent in a local optimum and cause it to miss a better policy. In this project's approach-avoid setup, this tension is concretized as a conflict at the behavioral level: always approaching may run into punishment, while excessive avoidance misses rewards. The "exploration level" knob among the 3 parameters directly corresponds to this dilemma—it controls how far the agent deviates from its current tendency to try new choices. Visualization lets viewers see that the learning process is essentially a dynamic balance in which exploration gradually gives way to exploitation, yet exploration cannot be completely abandoned.
How Visualization Reveals Learning Dynamics
The presentation of Watch a Brain Learn emphasizes "process" rather than "result." What viewers see is not the final policy after training is complete, but the trajectory of parameters as they change across interaction batches: early behavior is highly random and parameters fluctuate greatly; as experience accumulates, parameters gradually converge and behavior becomes stable.
This kind of visualization is very helpful for understanding several common phenomena in reinforcement learning. For example, exploration decay—early on the agent is more willing to try different choices, while later it relies more on the optimal policy it has learned; another example is the local optimum trap—parameters may converge too early to a suboptimal combination, producing "stubborn" behavioral patterns. Compared with reading loss curves, observing changes in behavior itself makes it easier for non-expert readers to build intuition.
Exploration decay is a common strategy in reinforcement learning training: as training progresses, the agent gradually reduces random attempts and relies more on the policy it has learned. Common implementations include decaying the ε value over time in ε-greedy strategies, or gradually lowering the temperature parameter in softmax strategies. Although this project does not explicitly state which mechanism it uses, the trajectory in the visualization—large parameter fluctuations early on and stabilization later—is an intuitive manifestation of exploration decay. Observing this process helps us understand that exploration decay is not simply "trying less and less," but a rational adjustment in which the agent, after accumulating enough experience, reallocates its limited behavioral budget to high-value options. If decay is too fast, the agent may lock in a suboptimal policy too early; if decay is too slow, learning efficiency is low. Visualization turns this trade-off from a hyperparameter table into a visible change in behavioral rhythm.
The Pedagogical Significance and Limitations of Minimalist Models
Projects like this are positioned for teaching and science communication, not as performance benchmarks. A 3-parameter agent cannot handle high-dimensional state spaces, nor can it represent the complexity of modern deep reinforcement learning systems. But it presents the skeleton of reinforcement learning in an observable way: states, actions, rewards, and policy updates.
For developers who want to get started with reinforcement learning, this path of "looking at behavior first, then at formulas" has its rationale. When abstract algorithms are reduced to individual, trackable parameter adjustments, concepts such as gradients, value functions, and policy gradients become easier to anchor to intuition. Of course, there is still a considerable gap between minimalist models and real applications, and the project is better suited as a starting point for understanding than as a replacement for systematic study.
Policy gradients and value functions are representative concepts of two core families of methods in reinforcement learning. Policy gradient methods perform gradient ascent directly on policy parameters to maximize expected return; value function methods first estimate the value of states or actions and then derive a policy from them. Although this project's 3-parameter agent does not explicitly distinguish between these two frameworks, its parameter update logic—fine-tuning approach/avoidance tendencies based on outcomes—is essentially a simplified policy parameterization: the parameters directly define behavioral tendencies, and the update rule plays the role of the "gradient." For beginners, first building intuition through this minimalist parameterization—"how parameters shape behavior, and how behavior feeds back into parameters"—and then transitioning to the mathematical forms of policy gradients or value functions is often easier than facing formulas directly. Understanding this correspondence helps map the behavioral changes in the visualization onto the algorithmic concepts encountered later in study.
Key Takeaways
Watch a Brain Learn reminds us that the core of reinforcement learning lies not in model scale, but in how feedback shapes behavior. An agent with only 3 parameters is already enough to demonstrate the basic logic of learning. For educators, this is a presentation approach worth borrowing; for learners, it offers a low-barrier observation window.
The project's popularity also reflects the community's demand for "explainable learning processes"—people are not satisfied with knowing that an algorithm works; they also want to see how it becomes effective step by step. This demand may encourage more researchers to treat visualization as part of algorithm explanation, rather than merely as an illustration in a paper appendix.
Related articles
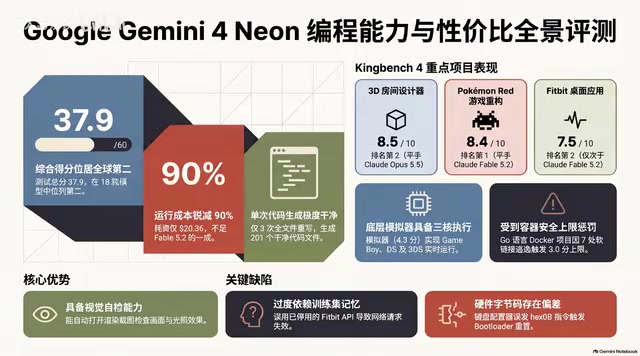
Gemini 4 Neon Hands-On: Value King or Confident Catastrophe?
Gemini 4 Neon review: 1M-token context, four thinking levels, 201 files in one KingBench4 pass at one-tenth Fable 5.2's cost—but it hallucinates fake data, leaves 7 symlink escapes, and bricks keyboards.

Google Gemini 4 Neon Hands-On: 6 3D Works That Impress and Fail
Hands-on with Google Gemini 4 Neon on a 3060 laptop: 6 3D works tested. Sunshower Fishing Harbor and mechanical keyboard impress; soft-body physics and faces fall short.

Gemini 4 Neo Web Novel Writing Test: Faint AI Flavor, Textured Dialogue
Bilibili creator's first-look review of Gemini 4 Neo for Chinese web novel writing: testing a Three Kingdoms transmigration opening with faint AI flavor, emotionally textured dialogue, and strong crisis building, plus comparison of 4A/4H/4C models and full workflow demos.