vLLM v0.31.1rc0 Released: Exposing Cached Prompt Token Metrics by Cache Tier

vLLM v0.31.1rc0 adds per-cache-tier prompt token hit metrics for better inference cost and performance visibility.
vLLM v0.31.1rc0's core change is the addition of per-cache-tier cached prompt token hit metrics (PR #56318). Modern inference systems use hierarchical KV Caches — GPU HBM, CPU DRAM, etc. — where hits at different tiers carry vastly different performance and cost implications. The new feature lets engineers precisely distinguish high-speed from low-speed cache hits, enabling more accurate evaluation of tiering strategies and cost optimization. Metrics are exposed via a Prometheus endpoint and integrate seamlessly with Grafana. As an rc0 release, testing in a non-production environment is recommended before upgrading.
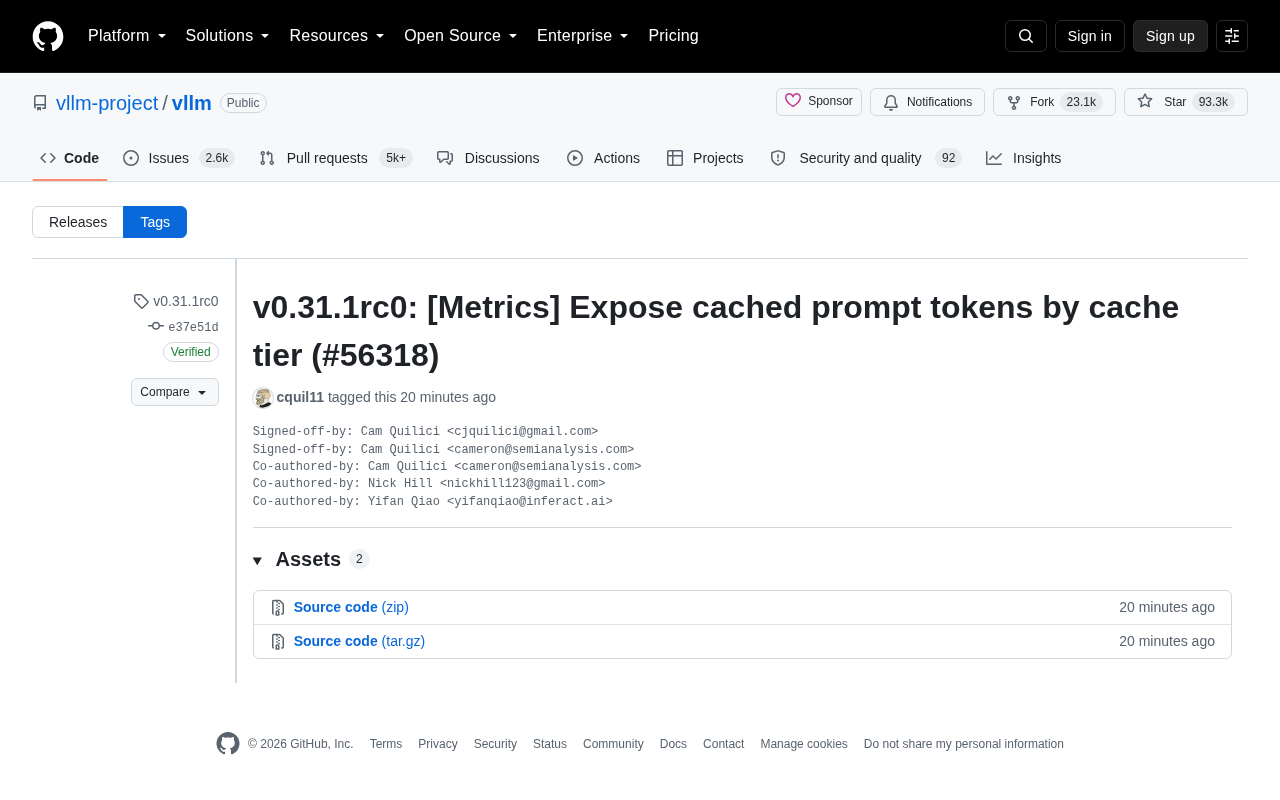
vLLM, one of the most widely adopted LLM inference engines today, has released its v0.31.1rc0 release candidate. The core change in this update is the addition of per-cache-tier exposure of cached prompt token metrics in the Metrics system (PR #56318) — a practically meaningful improvement for engineering teams focused on inference cost and performance monitoring.
Core Changes in This Release
The main highlight of this release candidate centers on observability. The new feature allows vLLM to separately count and expose the number of cached prompt tokens that were hit at each distinct cache tier.
In real-world inference services, Prefix Caching is a key mechanism for improving throughput and reducing latency. When multiple requests share the same system prompt or context prefix, the computed results for those tokens can be cached and reused, avoiding redundant computation. Previously, the metrics system could only show overall cache hit statistics, with no way to distinguish which cache tier a hit occurred at.
Why Differentiating Cache Tiers Matters
Caching in modern inference systems is typically hierarchical — for example, a high-speed cache tier residing in GPU HBM, alongside a secondary tier built on CPU memory or slower storage media. The performance gains and cost implications of hitting different tiers vary enormously: a hit in GPU memory is nearly zero-cost, while loading from a slower tier incurs additional data transfer overhead.
By exposing cached prompt tokens broken down by tier, operations and performance engineers can more precisely answer several key questions: How many tokens are truly benefiting from high-speed cache acceleration? Is the cache tiering strategy well-tuned? Are a significant number of requests only hitting the slower cache tier, dragging down overall performance? This granular data forms the foundation for optimizing cache configuration and evaluating cost-reduction outcomes.
vLLM's hierarchical caching system is commonly referred to as Tiered KV Cache. KV Cache (Key-Value Cache) is a fundamental optimization in Transformer inference — the Key and Value matrices generated while processing each token are saved to avoid recomputation in subsequent steps. Prefix Caching goes a step further: it persists the KV results for shared prefix portions across multiple requests, enabling cross-request reuse.
In actual vLLM deployments, this cache can span multiple storage tiers: the first tier is GPU HBM (High Bandwidth Memory), which offers the lowest access latency but limited capacity at the highest cost; the second tier can be CPU DRAM, which offers greater capacity but requires traversal of the PCIe bus, significantly increasing latency; longer-term options include NVMe SSDs or remote distributed caches. Bandwidth differences between tiers often span an order of magnitude, meaning the blanket description of "cache hit" obscures real performance differences — hitting a GPU memory cache versus a CPU memory cache can have a several-fold impact on request latency.
Implications for Inference Service Monitoring
For teams deploying vLLM at scale, the granularity of metrics directly determines the visibility of optimization opportunities.
Cached prompt token hit rates are often directly tied to inference costs. In token-based billing scenarios, cache hits translate to lower actual compute load. Being able to track this data by tier helps teams build more precise cost models and adjust cache capacity allocation, request scheduling, and prefix reuse strategies accordingly.
From a monitoring perspective, these metrics are typically exposed through standard interfaces like Prometheus, making it straightforward to integrate them into existing Grafana dashboards and alerting systems. Engineering teams can incorporate tiered cache data into their everyday SLO observability stack with no additional instrumentation required.
Prometheus is the most widely used time-series metrics collection system in the cloud-native ecosystem. It uses a pull model to periodically scrape metric endpoints and supports multi-dimensional aggregation queries via labels. vLLM ships with a built-in /metrics HTTP endpoint that exposes runtime metrics in Prometheus text format, covering dimensions such as throughput, queue length, and token generation speed. The new cache tier metrics are exposed through the same endpoint. Users can distinguish hits per cache tier by adding corresponding labels (e.g., cache_tier="gpu" or cache_tier="cpu"), and can plot tiered hit rate trend charts directly in Grafana using PromQL queries — no changes to existing collection configurations required.
A Note on Release Candidates (rc)
It's worth noting that the rc0 designation in v0.31.1rc0 identifies this as a Release Candidate. This means it is primarily intended for users who want to validate new features early or run compatibility tests, rather than serving as a stable production release.
This release was initiated on GitHub by contributor Cam Quilici and completed with input from multiple collaborators, with commits carrying GitHub's verified signature. Contributors come from organizations including SemiAnalysis and Inferact, reflecting vLLM's active cross-organizational collaboration ecosystem.
For production users, it is recommended to evaluate whether the new metrics functionality meets your monitoring requirements in a test environment before deciding on an upgrade timeline — ideally waiting for the official stable release.
Summary
vLLM continues to invest in the observability of its inference engine. While exposing cached prompt tokens by cache tier is a relatively focused feature, it directly addresses real pain points in cost optimization and performance tuning for large-scale inference deployments. As LLM inference services continue to scale, this kind of fine-grained instrumentation is becoming increasingly essential.
Related articles

ChatGPT Space Launches: Team Collaboration and New Pages Features Explained
ChatGPT Space is OpenAI's new team collaboration feature with Pages, real-time collaboration, and Slack/Google Drive sync. We break down its privacy design, multi-platform integration, and the full workflow from conversation to document.

Migrating Apache Spark UDFs to GPU Acceleration with AI Agents
NVIDIA developer blog explains how AI Agents rewrite Apache Spark UDFs for GPU acceleration, covering migration criteria, agent rewriting and verification workflows, plus pitfalls like result consistency and CPU-GPU transfer overhead.
Zed Editor v0.40.4-rc2 Released: Usage Credits Now Available Without Upgrading
Zed editor releases v0.40.4-rc2, allowing users to use usage credits for AI features without upgrading to a paid plan, lowering the trial barrier.