Wealth Inequality in America: Why a Chart Drawn to Scale Sparked a Debate
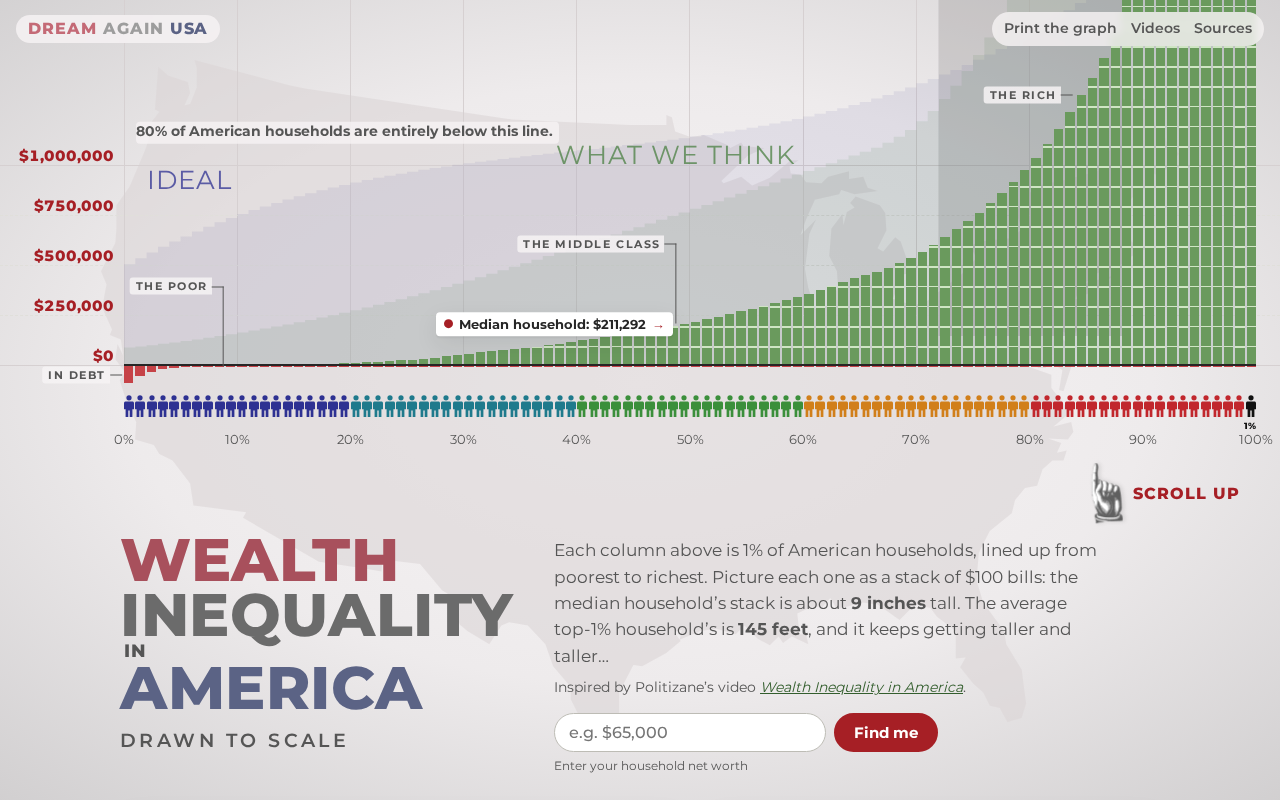
A scale-drawn wealth distribution chart sparks heated debate on Hacker News, reflecting both the impact and limits of visualization.
The article discusses a chart on Hacker News drawn to true scale showing U.S. wealth distribution. By mapping wealth gaps directly onto geometric proportions, the chart makes abstract data tangible and spreads easily. But intuitiveness brings simplification: wealth has many definitions, and a single-dimension chart can lead readers to equate the visualized gap with the entire gap. Commenters focus on data sources and definitions, the distinction between wealth stocks and income flows, and policy implications. The article offers lessons for creators: transparency determines credibility, scale charts should be paired with quantile and trend data, and the greatest value of such content lies in sparking cross-disciplinary discussion of data, ethics, and public policy.
A Chart That Drew Attention: Wealth Inequality Visualized "to Scale"
On Hacker News, a post titled "Wealth Inequality in America drawn to scale" received 105 points and 55 comments. The post itself carried no lengthy argument—its core was simply a wealth distribution chart drawn at true scale. By mapping wealth gaps directly onto geometric proportions, this approach makes abstract economic data tangible: when the wealth of the richest group is presented as an overwhelming area, readers need no statistical training to grasp the intuitive meaning of "inequality."
Here visualization is not decoration but the argument itself. It strips the distributional differences between income and wealth out of tables and percentages and translates them into visual proportional relationships. Precisely for this reason, such charts spread easily on social platforms—and equally invite scrutiny of data definitions and drawing methods.
Why "to Scale" Hits Harder Than Numbers
Scale as Rhetoric
When wealth is drawn at a single scale, the area or length of a shape corresponds directly to its numerical magnitude, and readers naturally make visual comparisons. Such comparisons bypass the threshold of understanding statistical terminology, turning "a huge gap" into "a gap visible at a glance." For a topic as highly skewed as wealth distribution, visualizations on a linear scale often produce a strong cognitive shock.
Linear and logarithmic scales are two fundamental coordinate mappings in data visualization. On a linear scale, the length or area of a shape is proportional to its value—double the value, double the length. A logarithmic scale maps equal proportional changes to equal distances, suiting data that span multiple orders of magnitude. Wealth distribution is typically extremely skewed: the wealth of the richest 1% may be hundreds of times the median. On a linear scale, this gap appears as an overwhelming area, creating a powerful visual impact; a logarithmic scale can show details across all quantiles at once but compresses the gap at the top, weakening the intuitive shock. Choosing a linear scale is therefore itself a rhetorical strategy—it amplifies extreme values so that readers first feel "the gap is enormous" rather than perceiving the overall shape of the distribution.
The Price of Intuitiveness
Intuitiveness also means simplification. The very definition of wealth admits multiple conventions: whether it includes real estate, whether debts are subtracted, whether retirement accounts count—all change the shape of the distribution. If a chart presents only a single dimension of proportional relationships, readers may easily equate "the visualized gap" with "the entire gap." The liveliness of the comment section stems largely from discussion of exactly such boundaries: the chart is good at raising attention but not necessarily at supporting nuanced policy debate.
What the Hacker News Comment Section Is Arguing About
Data Sources and Definitions
Common doubts about such visualizations center on where the data comes from, which year is measured, and what kinds of assets are covered. The post itself does not elaborate on this information, so discussion naturally turns to questioning the source. This reflects a broader problem: visualizations with strong传播 power are often weakest in methodological transparency.
Common sources for wealth distribution data include household surveys, tax records, and rich lists. Household surveys such as the Federal Reserve's Survey of Consumer Finances (SCF) cover all strata but have few high-net-worth samples and tend to underreport assets; tax records such as the World Inequality Database (WID) estimate top wealth using the estate-tax multiplier method, covering the full range but relying on assumptions; rich lists such as Forbes cover only the very top, useful for observing extremes but unable to reflect the overall distribution. Estimates of wealth concentration in the same country can differ by several percentage points across sources. Thus, if a chart drawn to scale does not state its data source and estimation method, readers cannot judge whether the gap it presents is conservative or exaggerated—which is precisely why methodological transparency is key to a visualization's credibility.
Wealth and Income Are Not the Same Thing
Another recurring point of disagreement is the confusion between wealth stocks and income flows. Income inequality and wealth inequality are two different curves, and the former's gap is usually smaller than the latter's. When a chart addresses only wealth, readers may mistakenly assume it also describes income. Keeping the two separate is a prerequisite for understanding such charts.
Wealth stocks and income flows are a basic distinction in macroeconomics. Income is what comes in per unit of time—wages, interest, dividends; wealth is net worth at a point in time, the stock of assets minus liabilities. Their dynamics differ: income is used for consumption and saving, savings gradually accumulate into wealth, and wealth in turn generates new income through capital gains. Because wealth can accumulate across generations and benefit from compounding, its distribution is typically more unequal than that of income. For example, the richest 1% of U.S. households own about one-third of all wealth but account for less than a quarter of income. Confusing the two throws policy discussions out of focus: income taxes versus property and inheritance taxes have fundamentally different mechanisms and redistributive effects.
Debating Policy Implications
Visualization itself offers no solutions, but it sparks discussion of taxation, inheritance, educational opportunity, and related issues. Disagreements in the comment section are often not about "whether the gap exists" but about "what the gap means" and "what should be done." This is also why such content keeps generating discussion in technical communities: it touches data, ethics, and public policy at once.
Lessons for Content Creators and Data Communication
Transparency Determines Credibility
If you use such scale-drawn charts in an article or presentation, you should at minimum state the data source, the statistical year, the definition of assets, and the drawing method. Without this information, the more impactful the chart, the more easily it is challenged as manipulation.
Let Visualization Do What It Does Best
Drawing to scale is good at revealing differences in magnitude and poor at showing distributional detail and trends. Use it as a hook, then supplement it with quantile data, time series, or comparisons of income and wealth to build a complete chain of argument.
Discussion Is More Valuable Than Conclusions
The value of such posts on Hacker News often lies not in the chart itself but in the cross-disciplinary discussion it provokes: some question the definitions, some add context, some propose alternative indicators. For readers, learning to identify what a chart "says" and "doesn't say" matters more than remembering the proportions on it.
Conclusion: How Far Can a Chart Go
"Wealth Inequality in America drawn to scale" drew attention because it conveys the most intuitive information in the minimal medium. But it also reminds us that visualization is a starting point, not an endpoint. Truly valuable discussion happens in the questions that follow the chart: where the data comes from, whether definitions are consistent, and what exactly we want to use it to show.
Related articles

OpenAI Breaks ETH? P=NP Could Upend the Cryptography World
OpenAI reportedly disproved ETH with a sub-exponential algorithm, sparking P=NP speculation. What it means for RSA, blockchain, and protein folding.
When an Anti-Fingerprinting Script Is …
When an Anti-Fingerprinting Script Is Flagged as a Bioweapon: The Detection Dilemma of Security Tools
An anti-fingerprinting script was flagged as a bioweapon by security scanning, sparking Hacker News debate. This analysis covers the causes of keyword-matching false positives, how developers respond, and the long-term imbalance between automation and precision in security tools.

41,000 DHS Employee Records Leaked, Including Undercover ICE Agents
Data breach exposes 41,000 DHS employees, including undercover ICE agents. Analysis of sensitive data risks, law enforcement security gaps, and protection measures like access control and auditing.