witr: An Open-Source Diagnostic Tool for One-Click Process Origin Tracing

witr is an open-source Go tool that traces any process, port, container, or file back to its launch origin.
witr (Why Is This Running) is an open-source diagnostic tool written in Go that solves a universal developer pain point: identifying what started a process, occupied a port, or locked a file. It unifies multi-dimensional investigation across processes, ports, containers, and files into a single tool with both CLI and TUI modes. With over 20K GitHub stars, it builds causal trace chains by leveraging Linux's /proc filesystem, cgroup parsing, and container runtime introspection.
A Frustration Every Developer Has Faced
"Who the hell started this process?" Every sysadmin or backend developer has faced this question during a late-night debugging session. When you discover a port is occupied, a container is mysteriously running, or a file is locked by some unknown process, the traditional troubleshooting approach requires jumping between a pile of commands like ps, lsof, netstat, and docker inspect — time-consuming and tedious.
In reality, these classic commands each excel in their own domain but remain disconnected from one another. ps can only display process snapshots, lsof focuses on mapping file descriptors to processes, netstat/ss handles network connection queries, and docker inspect is limited to container metadata. In practice, engineers must manually chain the outputs of these commands — first using netstat to find the PID corresponding to a port, then ps to view process details, followed by reading parent process information from /proc/PID/status, and finally perhaps docker inspect to confirm container ownership. This "human pipeline" is not only inefficient but also highly prone to losing critical clues during information handoffs.
An open-source tool on GitHub called witr (Why Is This Running) was born precisely to solve this pain point. Published by developer pranshuparmar and written in Go, the project quickly garnered over 20,000 Stars, with 234 new stars in a single day, demonstrating strong community enthusiasm. Its core mission is crystal clear: trace any process, port, container, or file back to the source that launched it.
What Problem Does witr Actually Solve?
A Complete Chain from Symptom to Root Cause
In real-world operations, what we see is typically just the "symptom" — a service occupying port 8080, a process maxing out CPU, or a file that can't be deleted because it's in use. But what we truly need to know is: what's the "causal chain" behind it? Which script, which systemd service, which container orchestration tool ultimately caused it to run?
The value of witr lies in connecting this entire chain. It doesn't settle for telling you "the process PID is 12345" — it goes further to trace back: who is this process's parent? Was it launched by a shell session, a cron job, or a container runtime? This "root cause tracing" capability is particularly critical for investigating ghost processes, zombie services, and resource leaks.
From a technical implementation perspective, the Linux kernel exposes rich process information through the /proc virtual filesystem. Every running process has a directory named after its PID under /proc, where /proc/PID/status contains process state and parent process PID (PPid), /proc/PID/cmdline records the startup command, /proc/PID/cgroup reveals cgroup membership (useful for determining if a process runs inside a container), and the /proc/PID/fd directory lists all open file descriptors. witr's "causal tracing" capability is built upon deep reads of these kernel interfaces — by recursively querying the PPid field, it constructs a complete process tree from the target process up to init/systemd; by parsing cgroup paths, it can associate processes with specific Docker containers or Kubernetes Pods.
It's worth noting that a zombie process refers to a process that has terminated but whose parent has not yet called the wait() system call to collect its exit status, displayed as Z state in ps output. While zombie processes don't consume CPU or memory resources, they occupy process table entries (PIDs), and when accumulated in large numbers, they can prevent the system from creating new processes. "Ghost processes" is a more colloquial term, typically referring to processes of unknown origin that nobody remembers starting yet continue running in the background consuming resources — they may originate from long-removed cron jobs, forgotten nohup commands, or service instances left over from failed deployments. Tracing the startup origin of such processes is one of the most headache-inducing problems in operations, and this is precisely witr's core capability.
A Unified Entry Point Across Multiple Dimensions
Another major highlight of witr is its unified entry point supporting multiple investigative dimensions:
- Process: Start from a PID and trace the launch chain upward
- Port: Reverse-lookup from a port number to find the occupying process and its origin
- Container: Trace the orchestration and launch mechanism behind a container
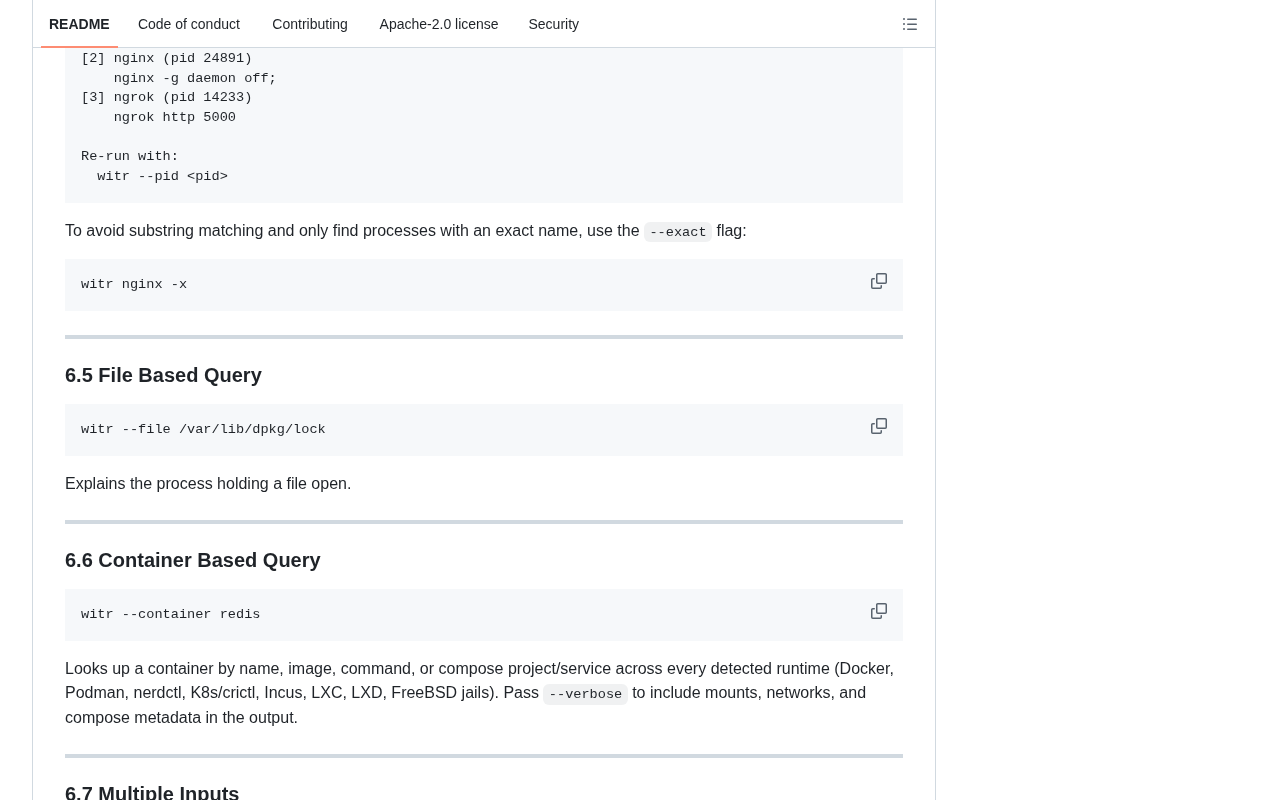
- File: Locate which process is reading, writing, or locking a specific file
This means developers no longer need to memorize a bunch of scattered command combinations — a single tool covers the vast majority of daily troubleshooting scenarios.
Among these, the container dimension is particularly complex to investigate. In containerized environments, confirming process ownership involves multiple layers of abstraction. Docker containers are essentially process isolation achieved through Linux namespaces and cgroups. A process inside a container is equally visible in the host's /proc filesystem, but its PID namespace differs from the host's — PID 1 seen inside the container might be PID 28456 on the host. When orchestration systems like Kubernetes are involved, the layers become even more complex: kubelet calls the container runtime (such as containerd), the container runtime creates container processes via runc, and there may be pause containers in between (used to maintain the Pod's network namespace). witr's container dimension support means it needs to parse these nested namespace and cgroup hierarchical relationships, accurately mapping "bare processes" seen on the host back to their owning container, Pod, or even Deployment.
CLI + TUI Dual-Mode Design
witr offers both Command-Line Interface (CLI) and Terminal User Interface (TUI) interaction modes, a key design decision that sets it apart from similar diagnostic tools.
CLI Mode: Ideal for Scripting and Automation
CLI mode is concise and efficient, suited for quick queries and integration into automation scripts. When you just want to quickly find out "who's using this port," a single command gives you the answer, and it can easily plug into CI/CD pipelines or monitoring alert scripts.
TUI Mode: Ideal for Interactive Deep Investigation
TUI mode provides a visual terminal interface that lets you browse the process tree more intuitively, expand parent-child relationships, and drill down layer by layer. For complex troubleshooting scenarios, the advantages of an interactive interface are especially apparent — you can freely navigate through the tree structure without repeatedly typing commands and copying PIDs.
Terminal User Interfaces (TUI) have experienced a notable renaissance in the developer tools space in recent years. The Bubble Tea framework (developed by the Charm team) and the tview library in the Go ecosystem have made building elegant terminal interactive interfaces easier than ever. Compared to traditional pure CLI output, TUIs support keyboard navigation, collapsible/expandable tree structures, real-time search filtering, and other interactive capabilities, while maintaining the core advantages of terminal tools — zero GUI dependencies and remote usability via SSH. Widely popular tools like lazygit, lazydocker, and k9s all adopt TUI design, proving the high acceptance of this pattern among developers. witr's TUI mode follows this trend, providing a more efficient experience for visual process tree browsing than repeatedly executing commands.
This "CLI for lightweight scripting, TUI for deep investigation" dual-mode strategy balances efficiency and experience, reflecting the author's deep understanding of developers' real workflows.
Why Go Was Chosen for Development
witr's use of Go is no coincidence. For system diagnostic tools of this nature, Go offers natural advantages:
-
Single binary distribution: The Go compiler statically links all dependencies (including the standard library) into a single executable, meaning the resulting binary doesn't depend on any shared libraries on the target system (with
CGO_ENABLED=0, it doesn't even depend on glibc). For system diagnostic tools, this characteristic is crucial: production servers often don't allow installation of additional runtimes (such as Python, Node.js, or JVM), and security policies may restrict package manager usage. A single binary means operations engineers canscpthe tool directly to the target machine and run it immediately, with zero installation steps. This "zero-dependency deployment" capability is also one of the key reasons Go dominates the infrastructure tools space (Docker, Kubernetes, Prometheus, Terraform, etc. are all written in Go). -
Excellent system programming capabilities: Go's support for system calls, process management, and concurrency handling is mature and stable, efficiently reading the
/procfilesystem, querying network connections, and container information. Go's goroutine and channel model makes concurrent reading of multiple/procsubdirectories and aggregating results both concise and efficient — essential for diagnostic tools that need to rapidly scan large amounts of process information. -
Cross-platform friendly: Go's cross-compilation capability (generating binaries for target platforms by simply setting
GOOSandGOARCHenvironment variables) allows the tool to conveniently cover different operating systems and architectures, from x86_64 servers to ARM-based edge devices.
These characteristics collectively ensure witr delivers the "grab-and-go, works-out-of-the-box" experience expected of a diagnostic tool.
Community Response and Ecosystem Positioning
Looking at the numbers, witr rapidly accumulated 20,018 Stars and 653 Forks after launch, with 234 new stars in a single day — an impressive growth rate for developer tool projects. It precisely targets a high-frequency pain point that virtually all backend and operations engineers encounter, yet has long lacked an elegant solution.
Interestingly, witr doesn't attempt to replace mature tools like ps, lsof, htop, or docker. Instead, it provides a layer of "causal tracing" abstraction on top of them. It's more like a "diagnostic assistant" that integrates fragmented troubleshooting steps, transforming the investigation process from "manually piecing together clues" to "one-click origin tracing."
Typical Use Cases and Recommendations
For engineers who frequently troubleshoot production issues, witr deserves a spot in your toolbox. It can significantly improve troubleshooting efficiency in the following scenarios:
- Port conflict investigation ("who's using this port")
- Ghost process and zombie process origin tracing
- Process ownership confirmation in containerized environments
- File lock/occupation issue diagnosis
Of course, as a rapidly rising young project, witr still has room to grow in terms of stability, edge case coverage, and documentation completeness. But judging from its design philosophy and community enthusiasm, it has already proven the value of the "causal tracing" diagnostic paradigm.
If it can further enhance its ability to parse deep dependency chains in Kubernetes and systemd, it has the potential to become a standard component in the Linux diagnostic tool ecosystem. As the default init system for modern Linux distributions, systemd defines service dependencies through unit files (Requires, Wants, After, Before directives), and a service's startup may result from cascading triggers across multiple unit files. In Kubernetes, a Pod's creation might be triggered by a Deployment controller, HPA (Horizontal Pod Autoscaler), CronJob, or even a custom Operator controller, resulting in very deep trace chains. Currently, most diagnostic tools stop at process-level parent-child relationship tracing and cannot yet penetrate through to systemd's unit dependency graph or Kubernetes' controller hierarchy. If witr can integrate information from systemctl and kubectl to complete these upper-level causal chains, it will fill an important gap in the tool ecosystem.
Conclusion
With a simple yet profound question — "Why is this running?" — witr redefines the approach to system diagnostics. It reminds us that true problem investigation shouldn't stop at "observing symptoms" but should trace back to "understanding causes." With its clean Go implementation, thoughtful CLI + TUI dual-mode design, and precise targeting of real developer pain points, witr is becoming the go-to tool for an increasing number of engineers when troubleshooting system issues.
Related articles

Differential Heuristics: Optimizing A* Search Efficiency with Landmark Precomputation
Deep dive into Differential Heuristics: using landmark precomputation and triangle inequality to build tighter heuristic functions that significantly reduce A* node expansions and boost pathfinding performance.

The Scaling Dilemma of Vertical AI Engine MLOps: Engineering Practices from Prototype to Scale
Exploring MLOps scaling challenges for vertical AI engines moving from prototype to production, covering model iteration pipelines, data drift detection, and inference cost optimization.

The Boy Who Cried Wolf Effect in AI Safety Warnings: Why the Public No Longer Believes "Dangerous"
The AI industry's repeated claims that new models are "too dangerous" have severely depleted public trust. This article analyzes how AI safety warnings became marketing tactics and how to rebuild credible risk communication.