Agent DevTools: A Local Debugger Designed Specifically for AI Agents

An open-source local debugger that makes AI Agent internals transparent and debuggable.
Agent DevTools is an open-source local debugger built specifically for AI Agents, letting developers inspect prompts, memory, retrieval, and tool calls at each step of execution. Its standout feature is good vs. bad run comparison for quickly identifying behavioral divergence. Currently supporting LangChain with a free Groq-based demo, it fills the gap between print() debugging and cloud-based observability platforms.
Still Using print() to Debug When Your AI Agent Goes Wrong?
Developers building AI Agents have probably all experienced this scenario: the Agent suddenly gives a nonsensical answer, retrieves the wrong memory, or calls a tool it shouldn't have. And what you end up doing is inserting one print() statement after another throughout your code, running it repeatedly, trying to reconstruct the Agent's "thinking" process. Often, a seemingly simple behavioral anomaly takes two hours to trace back to its root cause.
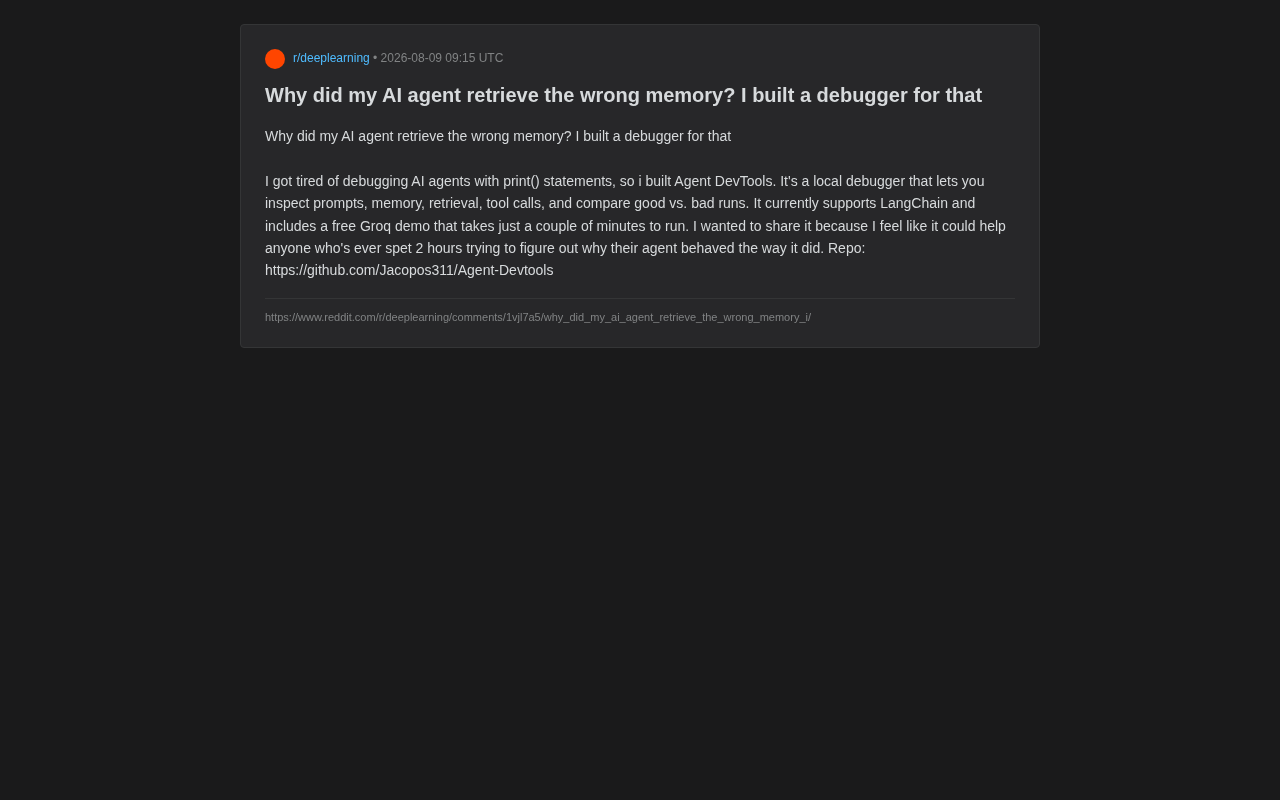
This is exactly the pain point that Reddit developer Jacopos311 decided to solve. Tired of debugging AI Agents with print() statements, he built a local debugger called Agent DevTools, hoping to help developers who have "spent two hours trying to figure out why their Agent did what it did."
The Black-Box Complexity of AI Agents: Why Traditional Debugging Fails
Before diving into Agent DevTools, it's important to understand the fundamental difference between AI Agents and traditional software. Traditional programs always produce the same output given the same input, and developers can trace execution paths step by step through breakpoints. AI Agents run on Large Language Models (LLMs), and even with identical inputs, each output may differ due to random factors like temperature parameters and sampling strategies (top-p/top-k).
What's more complex is that modern Agent architectures typically include multiple modules such as Planning, Memory, Tool Use, and Reflection, forming a multi-step decision chain. Small deviations at any step can be amplified in subsequent steps, producing a so-called "error cascade" effect that makes final behavior extremely difficult to trace back. This is why print() debugging is nearly useless for AI Agents — you're printing a local state at a single moment, but you can't grasp the causal relationships across the entire chain.
Agent DevTools: Core Features Explained
Unlike traditional log printing, Agent DevTools provides a systematic observability layer that makes an Agent's internal state transparent and inspectable. According to the author, it supports the following core features:
Full-Chain State Inspection
Agent DevTools allows developers to inspect multiple critical stages during an Agent's execution:
-
Prompts: View the complete prompt content actually sent to the model. This is crucial for troubleshooting prompt template concatenation errors and context injection issues. In practice, an Agent's final prompt is often dynamically assembled from system prompts, few-shot examples, conversation history, retrieved context, and more — format errors or missing content in any part can cause abnormal model behavior.
-
Memory: When an Agent retrieves incorrect memories, you can directly view the storage and retrieval state of memory to identify the problem. Agent memory systems typically split into short-term memory (conversation context window) and long-term memory (persistent storage), with different management strategies and different failure modes.
-
Retrieval: Inspect document chunks retrieved in the RAG pipeline to determine whether the retrieval stage recalled wrong content or whether the ranking logic was off. The complete RAG (Retrieval-Augmented Generation) pipeline includes document chunking → vector embedding → similarity search → Top-K recall → reranking → feeding into LLM. Any stage in this chain can fail: improper chunk granularity causing semantic fragmentation, embedding models poorly representing domain terminology, similarity thresholds set too loosely causing noisy document recall, etc. Agent DevTools' Retrieval inspection feature helps developers diagnose exactly which stage in this chain went wrong.
-
Tool Calls: Track which tools the Agent called, what parameters were passed, and what results were returned. In complex Agent systems, tool calls are often chained — one tool's output may serve as the next tool's input or influence the Agent's subsequent planning decisions.
Good vs. Bad Run Comparison
This is a particularly clever feature of Agent DevTools. Developers can side-by-side compare a "well-performing" run with an "anomalous" run to quickly identify differences in prompts, retrieval results, or tool calls. For non-deterministic LLM applications, this comparative debugging approach can dramatically shorten problem identification time.
This "diff comparison" methodology has counterparts in traditional debugging — similar to Git's diff functionality or A/B testing concepts. But in the AI Agent context, due to output non-determinism, simply comparing final results often provides no useful information. You need to drill into intermediate steps and compare them one by one to find the critical turning point that caused behavioral divergence.
Why Do AI Agents Need Dedicated Debugging Tools?
As AI Agents evolve from simple single-turn Q&A into complex systems with memory, retrieval, and multi-tool calling, their behavioral "black-box nature" becomes increasingly prominent. An Agent's final output may be the accumulated result of dozens of intermediate steps, and an error at any stage can affect the final performance.
Traditional software debugging has mature breakpoints, stack traces, and variable watch tools, but the AI Agent field has long lacked a native debugging experience equivalent to these. While observability platforms like LangSmith and LangFuse already provide tracing capabilities, most are cloud services oriented toward production monitoring.
From a technical background perspective, the concept of observability originates from control theory and was later introduced to distributed systems, typically encompassing three pillars: Logs, Metrics, and Traces. In traditional microservice architectures, standards like OpenTelemetry are quite mature. But AI Agent observability faces unique challenges: what needs to be recorded isn't just function calls and latency, but also complete prompt content, token consumption, model inference confidence, multi-turn conversation context window states, and more. LangSmith is the official tracing platform from LangChain, while LangFuse is an open-source alternative — both lean toward production environment monitoring and evaluation. Agent DevTools is positioned for immediate debugging during development, complementing rather than competing with them.
Tools like Agent DevTools that emphasize local-first, lightweight, debugging-focused design fill the gap during the early development rapid iteration phase.
The Value of Local-First
The author specifically emphasizes this is a "local debugger." For developers, running locally means lower latency, better privacy protection, and debugging freedom without relying on external services. During the rapid trial-and-error development phase, this instant feedback experience is particularly valuable.
Especially in enterprise scenarios, Agents often process sensitive business data — customer information, internal documents, financial data, etc. Uploading this debugging data to third-party cloud platforms may involve compliance risks. A local debugger completely bypasses this concern, allowing developers to confidently debug with real data without worrying about data leaks.
Quick Start: Free Demo Based on Groq
Agent DevTools currently supports the LangChain ecosystem. LangChain is currently the most widely used LLM application development framework, providing standardized abstractions for Chains, Agents, Memory, Retrieval, and more. Its core design philosophy is to modularize various components of LLM applications and achieve flexible composition through LCEL (LangChain Expression Language). The LangChain ecosystem also includes LangGraph (for building stateful multi-step Agents), LangServe (deploying as APIs), and LangSmith (observability platform). Agent DevTools chose to support LangChain first both because of its largest user base and because LangChain's callback mechanism naturally supports external tools hooking into runtime data. However, this also means developers using other frameworks like CrewAI, AutoGen, or Semantic Kernel cannot benefit for now.
The project also includes a built-in free demo based on Groq. The author says it takes only a few minutes to get running. Groq is an AI inference chip company whose proprietary LPU (Language Processing Unit) architecture is specifically optimized for large language model inference. Unlike GPU's batch parallel computing, LPU uses deterministic computation paths, eliminating the memory bandwidth bottlenecks common in GPU inference. In practice, Groq can achieve generation speeds of hundreds of tokens per second, far exceeding traditional GPU inference solutions. Groq also offers a free API tier (with rate limits) supporting open-source models like Llama and Mixtral.
Using Groq for the demo allows developers to experience the complete Agent debugging workflow at extremely low latency without spending money or configuring local models — truly delivering on the promise of "running within minutes." This "out-of-the-box" design lowers the barrier to trying it out, which is also quite advantageous for promoting open-source projects.
The project is open-sourced on GitHub: github.com/Jacopos311/Agent-Devtools
Reflections on the AI Agent Engineering Trend
Agent DevTools is currently an early-stage project driven by an individual developer. Its feature coverage and stability still need community validation, and it only supports LangChain for now. But it reflects a noteworthy trend: AI Agent engineering is maturing.
As more developers shift from "getting it to run" to "making it reliable and maintainable," demand for supporting debugging, testing, and monitoring toolchains will explode. From a panoramic perspective, AI Agent engineering encompasses not just debugging but the complete lifecycle of testing, evaluation, deployment, and monitoring. At the evaluation layer, there are frameworks like Ragas (RAG quality assessment) and DeepEval (LLM output unit testing); at the prompt management layer, there are version control tools like PromptLayer and Humanloop; at the deployment layer, there are high-performance inference engines like vLLM and TGI. Agent DevTools fills the gap at the most upstream "development debugging" stage.
It's foreseeable that the tooling ecosystem around Agent observability will become critical infrastructure for the next phase of AI application development. As these scattered tools gradually consolidate, we'll see the AI Agent equivalent of the mature toolchain found in traditional software development — IDE + CI/CD + APM — or rather, the full formation of the "LLMOps" pipeline.
For developers currently tormented by Agent debugging, rather than continuing to struggle in a sea of print() statements, try dedicated debugging tools designed for Agents — you might compress those two hours of investigation down to a few minutes.
Related articles

oqoqo: A Developer Tool for Building Custom AI Evaluation Benchmarks with Real-World Tasks
oqoqo is a developer-focused AI evaluation tool for building private benchmarks, measuring Agent performance on real products, and optimizing model selection across GPT, Claude, and Gemini.

Prime Agent: An Open-Source Coding Agent That Can Improve Its Own Underlying Framework
Prime Agent is an open-source self-improving coding agent using Recursive Language Models and Continual Harness abstractions, achieving 95.5% on ARC-AGI-3.

Salesman AI: A Full-Cycle Sales AI Assistant from Pre-Meeting Rehearsal to Post-Meeting Follow-Up
Salesman AI is a full-cycle AI sales assistant covering pre-meeting buyer intelligence, adaptive rehearsal, post-meeting deal intelligence extraction, and follow-up management to turn every meeting into measurable pipeline progress.