AI Agent for Research Visualization: A Practical Guide to Multi-Level Sankey Diagrams

PlugCase case library combines AI Agents and MCP to automate multi-level Sankey diagram generation and code adaptation.
The article explores the challenges of creating multi-level Sankey diagrams in research data visualization and proposes a solution centered on the PlugCase data visualization case knowledge base, integrated with AI Agents via the MCP protocol. PlugCase consolidates Sankey diagrams, network graphs, plotting code, and method descriptions, enabling Agents to retrieve similar cases, map data fields, and generate runnable code. The article breaks down the three operational steps—integrating MCP, submitting requirements, and retrieving/adapting cases—and notes that this approach significantly shortens the path from data to chart. It also emphasizes the need for case library coverage and manual verification, arguing that case-driven generation is more controllable and closer to research plotting workflows than pure code generation.
Research data visualization often struggles to clearly present multi-level flows, especially for charts like Sankey diagrams that require precise representation of flow volumes and node relationships. Traditionally, researchers had to manually write plotting code and repeatedly debug styles—time-consuming and error-prone. Today, the combination of AI Agents and dedicated case knowledge bases is redefining this workflow.
Core Challenges of Multi-Level Sankey Diagrams
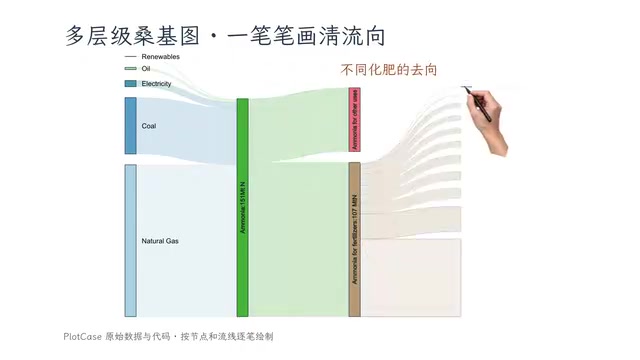
Sankey diagrams excel at expressing flow paths from sources to sinks, but when data involves multiple levels—for example, from energy input to intermediate product manufacturing to final fertilizer destinations—organizing nodes and links becomes extremely complex. Link width represents flow volume, and node positioning and level division directly affect readability. Researchers often need to repeatedly adjust layout parameters to make the chart both accurate and visually appealing.
According to the original material, multi-level Sankey diagrams need to "connect the flow at each step" and clearly state that "the wider the link, the larger the flow." This means the plotting tool must not only handle data aggregation but also support level definitions and visual mapping. For non-expert visualization developers, building such charts from scratch is a high barrier.
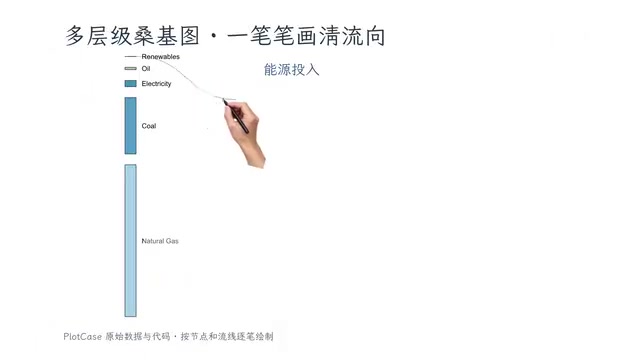
A Sankey Diagram is a flow visualization chart proposed by Matthew Henry Phineas Riall Sankey in 1898, originally used to demonstrate the energy efficiency of steam engines. Its core elements include nodes and links, where link width is proportional to flow value, intuitively showing the distribution and loss of resources or energy across system stages. Multi-level Sankey diagrams introduce the concept of layers, dividing nodes into multiple stages by business logic (e.g., input, conversion, output), with links connecting across layers to form a directed acyclic graph (DAG). This structure requires data with clear start points, end points, and intermediate aggregation logic, and the total node volume at each level must satisfy conservation (inflow equals outflow plus loss). Common implementation libraries include Plotly, D3.js, and ECharts, but all require manual definition of node indices, link relationships, and layout parameters.
PlugCase Knowledge Base: A Case-Driven Plotting Approach
PlugCase is positioned as a data visualization case knowledge base, covering resources such as Sankey diagrams, network graphs, charts, vision data, plotting code, and method descriptions. Its core value lies in binding "cases" with "code": users can not only view the final effect images but also obtain the corresponding plotting code and implementation methods. This structure gives AI Agents a searchable reference basis rather than generating code out of thin air.
After integrating PlugCase's MCP (Model Context Protocol) into an AI Agent, the Agent can access this knowledge base. When a user submits data and plotting requirements, the Agent retrieves relevant cases, adapts data fields, and then writes visualization code. This workflow delegates the repetitive labor of "finding cases—modifying data—adjusting code" to the Agent, so researchers only need to focus on the data itself and the final presentation.

MCP (Model Context Protocol) is an open protocol proposed by Anthropic in 2024, aimed at standardizing the interaction between AI assistants and external tools and data sources. Under the MCP framework, AI Agents can access knowledge bases, databases, APIs, and other resources through a unified interface without writing separate integration code for each data source. Specifically for the PlugCase scenario, PlugCase acts as an MCP server exposing capabilities such as case retrieval and code acquisition, while the AI Agent acts as a client initiating requests. The protocol handles authentication, request routing, and response formatting. This architecture enables the Agent to dynamically discover available tools and combine calls based on user needs, thereby automating the "retrieve cases—adapt data—generate code" workflow.
How AI Agents Integrate and Complete Plotting
The specific operation path can be broken down into three steps. The first step is to integrate MCP, giving the Agent the ability to access the PlugCase case library. The second step is to submit data and requirement descriptions, for example, specifying which levels the data contains and which flows need to be highlighted. The third step is for the Agent to retrieve matching cases, adjust the code based on field mappings, and generate runnable plotting scripts.
In this process, the Agent's advantage lies in quickly matching case templates and handling data field correspondences. For multi-level Sankey diagrams, the Agent can find structurally similar cases from the knowledge base, reuse their level definitions and style configurations, and then replace nodes and flow values with actual data. This is more efficient than writing code from scratch and reduces the probability of errors.
Boundaries of Case Library and Agent Collaboration
It's worth noting that the collaboration model between PlugCase and AI Agents still depends on the coverage of the case library. If the knowledge base lacks certain chart types or special data structures, the Agent's adaptation capability will be limited. The original material emphasizes that "from Sankey diagrams to network graphs, charts, vision data, plotting code, and method descriptions—all available for reference together," indicating that the breadth of the knowledge base is the foundation of this approach.
On the other hand, the code generated by the Agent still requires manual verification. Whether data field mappings are accurate, whether level relationships conform to business logic, and whether link widths truly reflect flow proportions—all of these need final confirmation by the researcher. The AI Agent plays the role of an accelerator here, not a complete replacement for human judgment.
The coverage of the case library directly determines the quality of the Agent's generation. If the knowledge base lacks the target chart type or the data structure doesn't match, the Agent may fall back to generic code generation, losing the advantage of case-driven generation. In addition, the code quality of cases, data field naming conventions, and the modularity of style configurations all affect reuse effectiveness. Therefore, building a sustainable case library requires establishing case review mechanisms, field mapping standards, and version management strategies. For research scenarios, data privacy and intellectual property issues must also be considered to ensure that the code and data in the case library can be safely shared.
Practical Significance for Research Visualization
For research scenarios that require frequent creation of multi-level flow diagrams, the value of this approach lies in shortening the path from data to chart. Researchers no longer need to spend large amounts of time on plotting library APIs and style parameters. Instead, they describe requirements in natural language, and the Agent calls the case library to complete the initial code. Subsequent adjustments can also be made based on the existing code, making iteration faster.
PlugCase lets AI Agents "draw with cases open," essentially distilling visualization experience into searchable case assets and then enabling the Agent to reuse these assets through MCP. For chart types like Sankey diagrams with complex structures and numerous parameters, case-driven generation is more controllable than pure code generation and closer to the real workflow of research plotting.
Related articles
world2vec: Building Mechanistic World Models with Latent Dynamics Learning
world2vec proposes a reward-free method for learning mechanistic world models via latent dynamics, faithfully reproducing systems over long horizons with at least an order of magnitude fewer parameters than DreamerV3, TD-MPC2, and LeWM, and achieving accurate system identification on 71 attractor benchmarks.

A New KL-DRO Paradigm: Adaptive Scenario Generation Around a Learned Density Model
KL-DRO research proposes centering the KL ball on a learned density model instead of the empirical distribution, with adaptive scenario generation guiding sampling toward the worst case. Experiments show lower cost under distribution shift when records are scarce and the model can extrapolate, with comparable in-distribution cost.

ODE Samplers for Discrete Diffusion Models: Exponential Residual Flows Accelerate Generation
Discrete diffusion models lack deterministic ODE sampling? This article introduces Exponential Residual Flows (ERFs), which introduce continuous residual variables per token to construct piecewise ODEs for deterministic sampling and support consistency distillation acceleration. Superior to prior methods on code and text generation tasks.