AI-Powered Logic Analyzer and Socket Debugging: A Breakthrough in Closed-Loop Embedded Programming

AI now reads logic analyzers and debugs Sockets autonomously, closing the embedded programming loop.
点线面 v4.3.0 lets AI directly access logic analyzer data and network Socket debugging, enabling real-time feedback from both the hardware signal layer and the network communication layer. This creates a full "generate → run → measure → correct" automated loop, extending AI-assisted programming from virtual environments into the physical world and significantly accelerating embedded and IoT development.
From Code Generation to Hardware Debugging: A Critical Step Toward Closed-Loop AI Programming
As AI-assisted programming evolves rapidly, most tools remain stuck in a semi-closed-loop of "generate code → manual verification." The concept of a programming closed loop draws from control theory — where system outputs are fed back to the input for continuous error correction. Early AI coding tools like the original GitHub Copilot offered only code completion, a classic open-loop system: the AI produces code but cannot perceive runtime results. Around 2023, "AI software engineers" like Devin began executing code in sandbox environments and auto-fixing errors based on output, achieving a software-level semi-closed loop. With version 4.3.0, 点线面 (Diǎn Xiàn Miàn) delivers a pivotal breakthrough — enabling AI to directly invoke a logic analyzer and network Socket debugging capabilities. This bridges the most critical verification steps in embedded and network development, extending the closed-loop boundary from "virtual environments" into the physical world, and realizing a truly automated programming closed loop.
The core value of this update: AI is no longer just a "code-writing assistant." It can now actively retrieve real-time feedback from the hardware layer and network layer, assess program runtime status, pinpoint issues, and autonomously apply corrections. This marks a genuine extension of AI-assisted programming from the text layer to the physical layer.
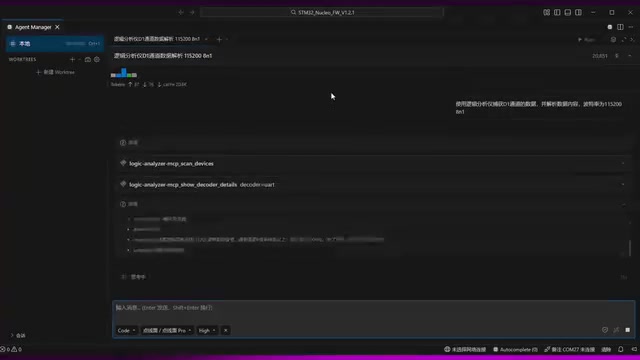
Logic Analyzer: Giving AI Eyes That Can "See" Signals
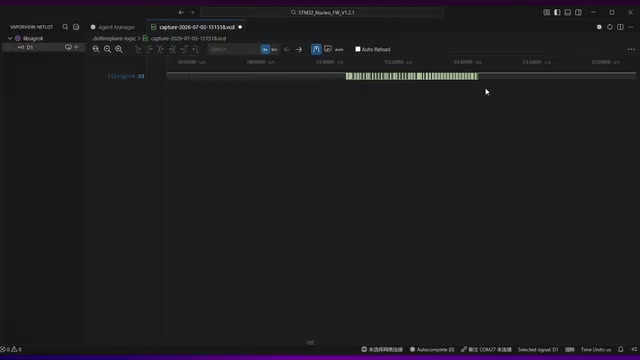
A logic analyzer is an indispensable professional instrument in embedded development. It simultaneously captures multiple digital signal channels and displays their logic-level (high/low) transitions as timing diagrams — widely used in embedded systems development, FPGA debugging, and communication protocol verification. Unlike oscilloscopes, which focus on analog waveforms, modern logic analyzers typically include built-in protocol decoders that automatically parse frame structures for common protocols like I2C, SPI, UART, and CAN, translating raw timing waveforms into readable packet content. In traditional workflows, developers must manually wire connections, capture waveforms, and visually inspect timing — a time-consuming and error-prone process.
The three protocols involved each have distinct characteristics: I2C uses a two-wire interface (SCL clock + SDA data) and supports multi-master/multi-slave architectures, commonly used for sensor-to-MCU communication; SPI uses four wires with faster transfer rates, suited for high-speed peripherals like displays and Flash memory; UART is the simplest asynchronous serial protocol, requiring no clock line and widely used for debug output and inter-module communication. Each protocol has strict timing requirements — even slight deviations in signal setup time or hold time can cause communication failures, which is precisely why logic analyzers are indispensable in development.
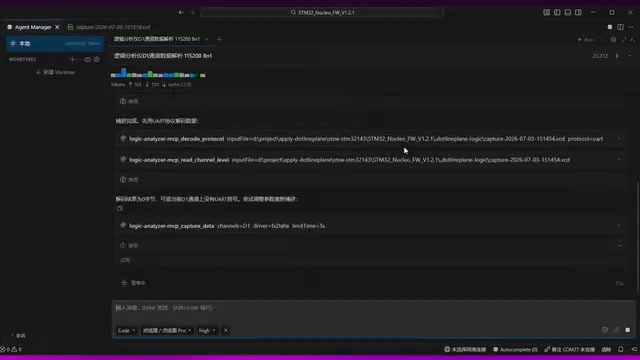
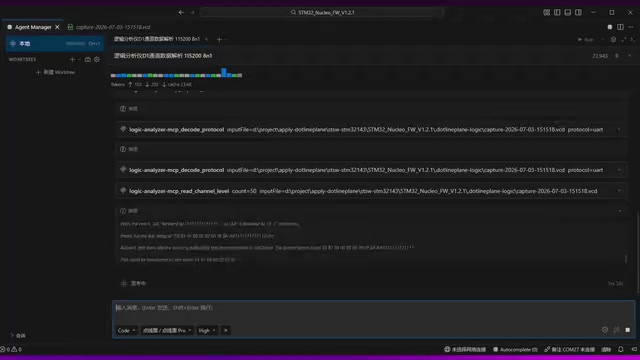
In v4.3.0, the AI can directly read data captured by the logic analyzer. After writing code to drive I2C, SPI, or UART communication, the AI can immediately verify signal timing correctness via the logic analyzer — including clock frequency, data setup time, and protocol frame structure. Upon detecting waveform anomalies, the AI can reverse-engineer the underlying code issue and automatically adjust parameters, with no manual interpretation required.
Network Socket Debugging: Automating Communication Layer Verification
A Socket is the fundamental abstraction layer for network programming, first introduced in BSD Unix in 1983 and now a standard network interface on virtually every operating system. Sockets support two primary communication modes: TCP (connection-oriented, reliable) and UDP (connectionless, low-latency). In IoT development, device-side programs typically exchange data with cloud servers or local gateways via Sockets. Common failure modes include TCP packet adhesion (multiple packets merged on receipt), heartbeat timeouts, TLS handshake failures, and protocol mismatches. Traditional debugging relies on manual analysis with tools like Wireshark — a cumbersome process that demands deep knowledge of network protocols.
The network Socket debugging capability added in v4.3.0 is particularly valuable for IoT device and network service development. The AI can proactively establish Socket connections, send and receive data packets, and monitor communication status to autonomously verify network program correctness. With Socket debugging, the AI can independently complete the full cycle of "send test data → capture response → analyze anomalies → fix code," dramatically compressing network program debugging cycles.
Hardware Feedback + Network Feedback: Two Pillars of the Closed Loop
Combining the logic analyzer with network Socket debugging effectively gives the AI two critical real-world feedback channels: one targeting low-level hardware signals, the other targeting the network communication layer. Together, they form the physical foundation of an automated programming closed loop.
Feedback is the essence of a closed loop. Previously, AI-generated code could not be self-verified — developers had to manually test and report issues, which was inefficient and prone to human error. Now the AI can "take measurements" autonomously, forming a complete cycle of generate → run → measure → correct. This is what truly automated programming should look like.
A Telling Moment: The Real Value of Autonomous AI Troubleshooting
According to the author, an unexpected issue arose during the recording of the demo video — which the AI ultimately resolved on its own. This seemingly minor detail is a perfect real-world validation of closed-loop debugging capability.
When the development environment encounters an anomaly — whether a hardware connection fault or a network response timeout — an AI with debugging capabilities can identify the root cause through logic analyzer data or Socket return values, and attempt self-repair rather than stalling to await human intervention. This ability to "handle problems independently" is the critical dividing line between a tool that's "demo-ready" and one that's truly production-ready. It also directly demonstrates the real-world deployment capability of Agentic AI in vertical engineering domains.
What This Means for Embedded and Network Developers
The evolution of tools like this carries significant implications for how developers work:
- Lower debugging barriers: Beginners no longer need to master complex logic analyzer operations — the AI handles signal interpretation and timing analysis.
- Shorter iteration cycles: The loop from writing code to verifying results is dramatically compressed, accelerating product development.
- Less repetitive work: Mechanical tasks like packet capture, waveform analysis, and sending test packets are handled by the AI, freeing developers to focus on higher-level design decisions.
Summary and Outlook
With v4.3.0, 点线面 takes a meaningful step toward extending the AI programming closed loop into the physical world by integrating logic analyzer access and network Socket debugging. While still in its early stages — and requiring further validation across more real-world scenarios in terms of stability and scope — this direction undeniably represents an important trend in AI-assisted embedded development.
As AI gains access to more real-time hardware and environmental feedback channels, the vision of "AI autonomously completing everything from requirements to a running hardware system" may gradually become reality. The developer's role could shift from "writing and debugging code" toward "defining objectives and reviewing outcomes." This is both an opportunity brought by technological progress and a development worth every practitioner's continued attention and reflection.
Key Takeaways
Related articles
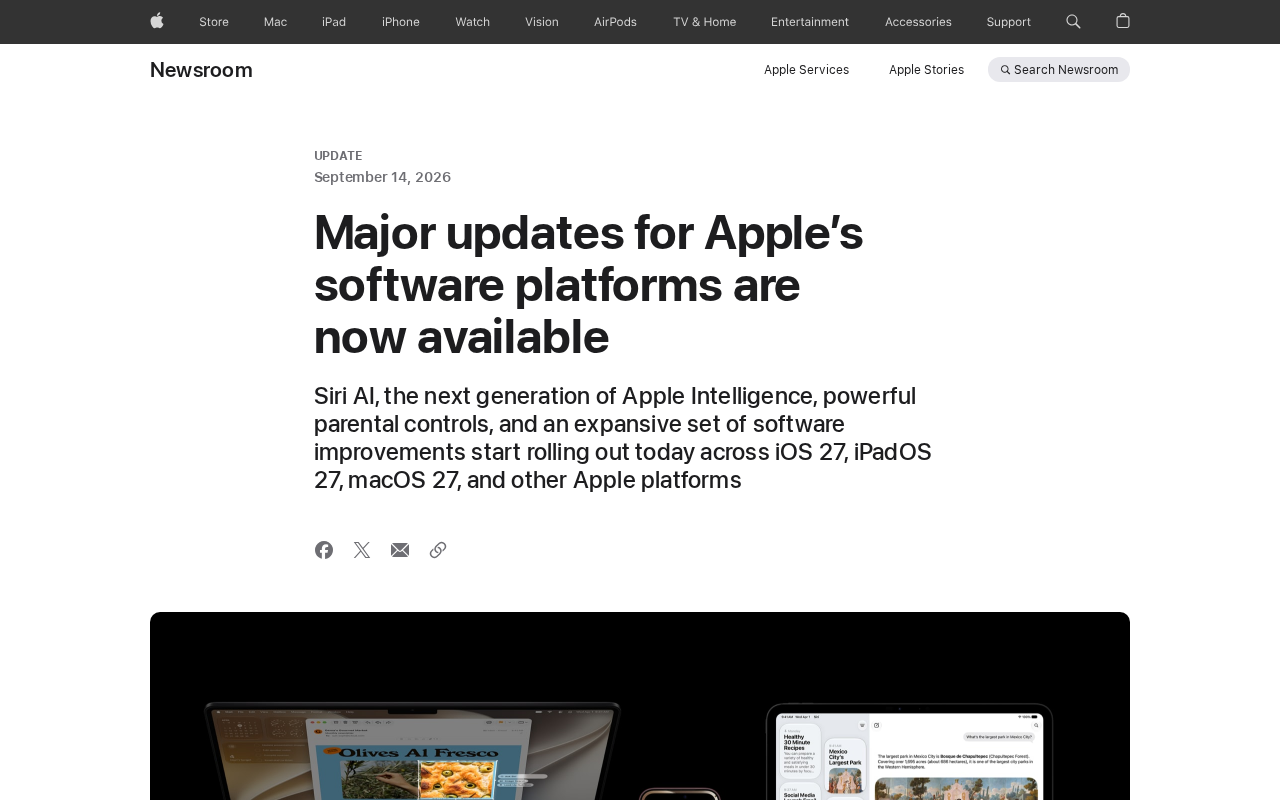
iOS 27, iPadOS 27, and macOS 27: The Information Gap Behind a Discussion
A Hacker News post about iOS 27, iPadOS 27, and macOS 27 sparked speculation about Apple unifying its version numbering. Here's how to read it with limited info.
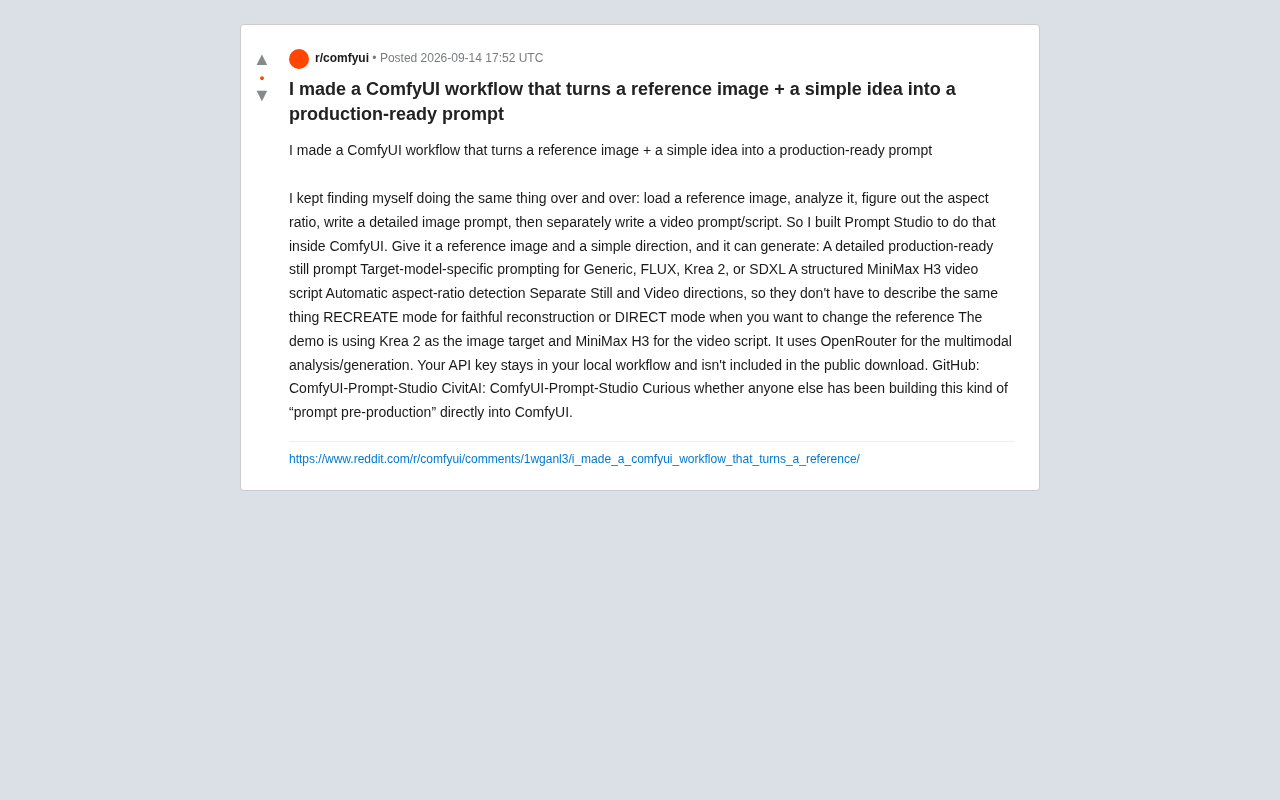
ComfyUI Prompt Studio: A Workflow for Turning Reference Images into Production-Ready Prompts
ComfyUI Prompt Studio is an open-source workflow that auto-generates production-ready image prompts, multi-model custom prompts, and MiniMax video scripts from reference images.
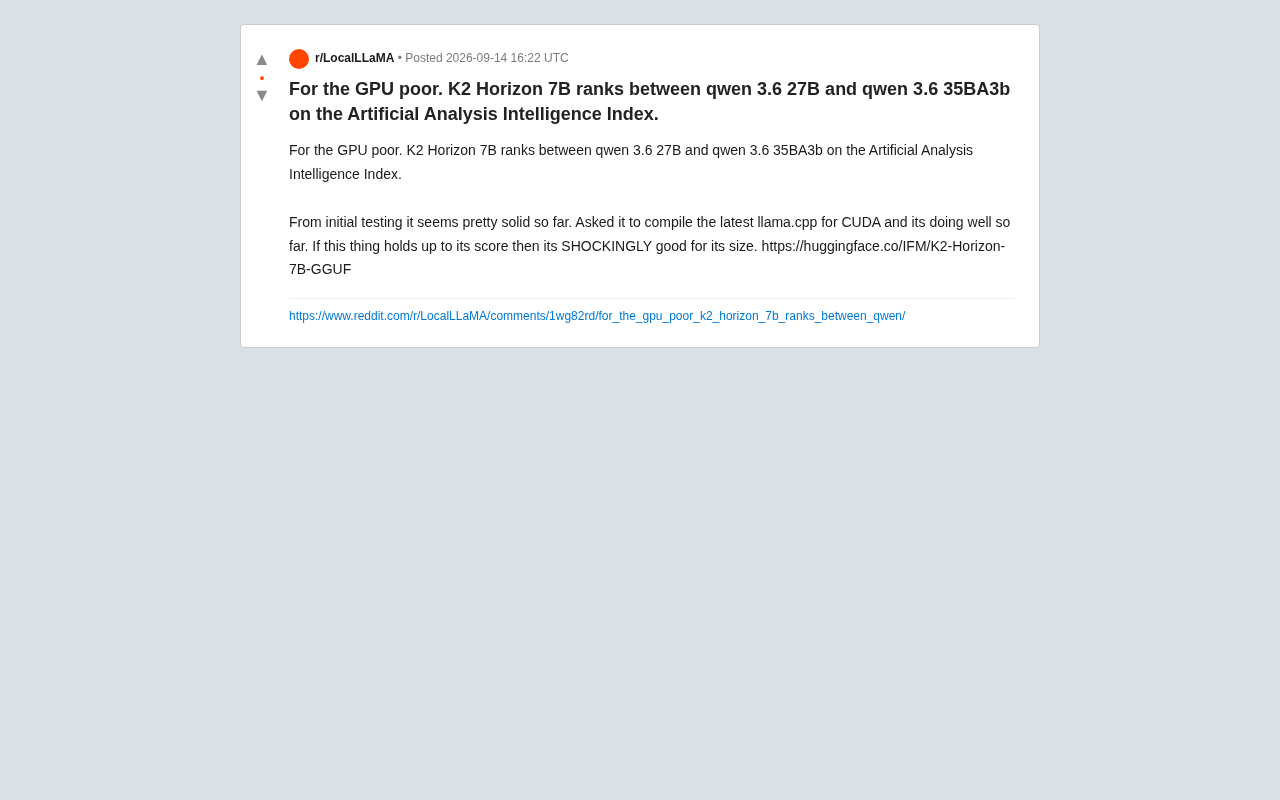
K2 Horizon 7B: A Small Model Punching Above Its Weight
K2 Horizon 7B ranks between Qwen 3.6 27B and 35BA3b on the Artificial Analysis Intelligence Index, delivering near-mid-tier intelligence at 7B parameters — a strong local deployment option.