AI Supply Chain Map: Who Has Whom by the Throat?

A new study maps the organizational relationship network of the AI supply chain, using datasets and structural indicators to measure concentration and chokepoint risks.
A new study attempts to systematically map the organizational relationship network in the AI supply chain, covering flows of models, data, chips, infrastructure, capital, and talent, rather than merely a layered technical stack diagram. The study points out that the information gap creates six types of problems: market concentration, power imbalance, single-point chokepoints, cascading failures, fragmented accountability, and systemic risk. The team built a pipeline to extract organizational relationships from public information, produced a multi-layer large-scale dataset and made it public on Hugging Face, and identified key nodes and chokepoints through centrality, concentration, and community analysis. The authors acknowledge that the data is limited by public information and necessarily incomplete, and recommend using it as a baseline combined with first-hand research verification, providing measurable structural evidence for AI governance, corporate risk management, and academic research.
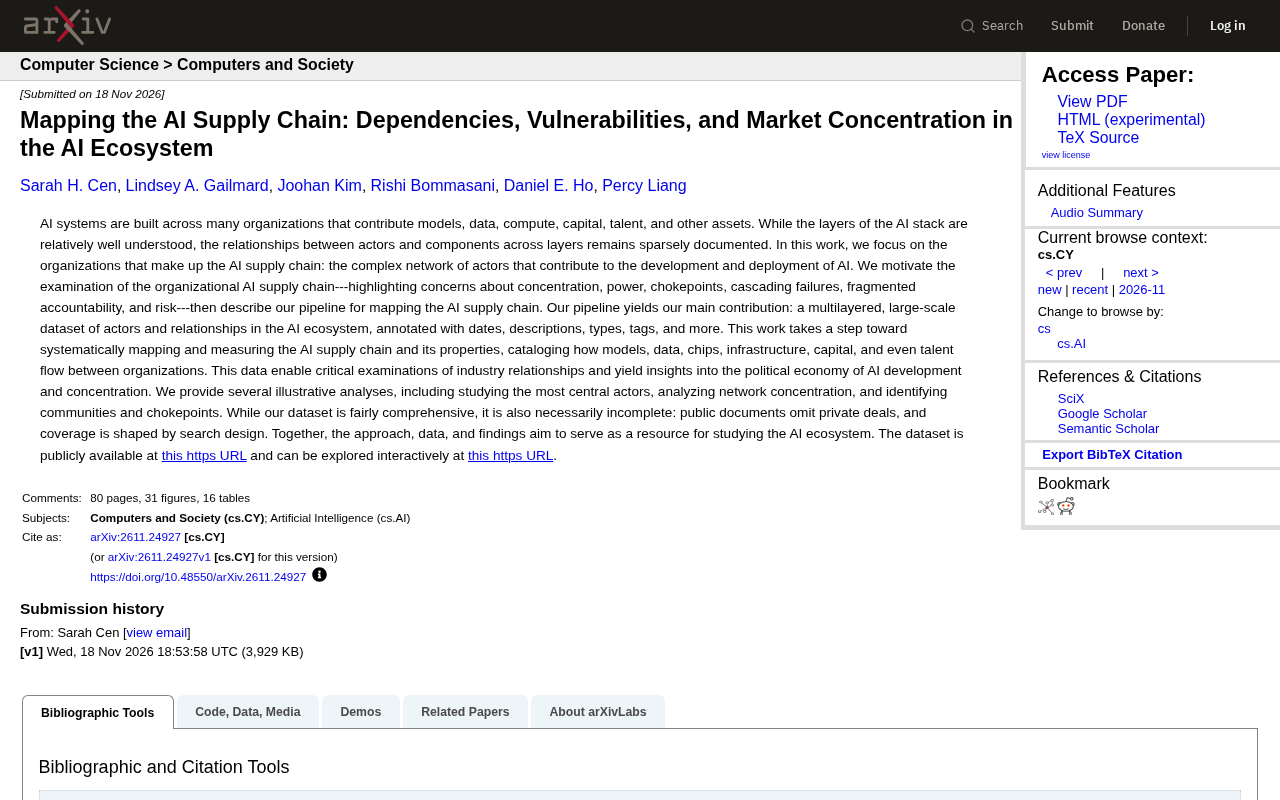
When a model is invoked, it may involve dozens or even hundreds of organizations behind the scenes: cloud providers supplying compute, semiconductor companies designing chips, vertical platforms providing training data, funds injecting capital, and talent flowing between labs. These relationships are rarely systematically recorded, yet they determine the real power structure of the AI industry. A new study attempts to draw this network—mapping dependencies and concentration among organizations layer by layer, from models, data, and chips to infrastructure, capital, and talent.
Why an Organization-Level AI Supply Chain Map Is Needed
The layered structure of the AI stack (chips, cloud, models, applications) has been widely discussed, but "who depends on whom" between layers has never been systematically recorded. The study points out that this information gap creates six types of risk: market concentration, power imbalance, single-point chokepoints, cascading failures, fragmented accountability, and hard-to-quantify systemic risk.
Take chips as an example: AI training depends on GPUs from a very small number of suppliers, and GPUs in turn depend on even further upstream manufacturing and packaging capacity. Any disruption in one link propagates down the chain, but most existing industry analyses look at only a single segment and lack cross-layer organizational relationship data. This is precisely the gap the study aims to fill: not another technical stack diagram, but collecting and measuring specific organizations and their relationships as data objects.
Chokepoint refers to a critical link in the supply chain controlled by very few organizations—once blocked, the entire chain is severely affected. In AI, typical chokepoints include advanced-node chip manufacturing, GPU packaging capacity, and compute supply from a handful of cloud providers. A chokepoint differs from ordinary "concentration": concentration describes market share distribution, while a chokepoint emphasizes irreplaceability and transmissibility—even if a link accounts for only a small fraction of overall cost, it can become a vulnerability of the entire system. Identifying chokepoints requires examining the availability of alternatives, switching costs, and geographic distribution simultaneously, which is why the study treats organizational relationships as data objects rather than merely tallying market share.
How the Data Pipeline Maps Organizational Relationships
The research team built a pipeline that extracts organizational relationships from public information, producing a multi-layer, large-scale dataset that records participants and their relationships in the AI ecosystem, annotated with dates, descriptions, types, tags, and other attributes. The dataset covers flows between organizations across models, data, chips, infrastructure, capital, and even talent.
According to the study, the data pipeline aims to systematically map and measure the AI supply chain and its attributes. The dataset is publicly available on Hugging Face (sarahcen/ai-supply-chain) and can be browsed interactively at aisupplychains.org. This open approach allows other researchers to review, extend, or challenge the mapping results rather than accept a black-box report.
Who Is Most Central: A Few Illustrative Analyses
The paper presents several illustrative analyses, three of which are noteworthy.
Centrality analysis identifies the most connected organizations in the network—they often span multiple layers, both providing compute and investing in model companies, forming nodes that are hard to bypass. Concentration analysis quantifies the degree of concentration in each layer's market, revealing which segments are dominated by a few organizations. Community and chokepoint identification finds densely connected clusters and the critical bridges connecting different clusters—bridges that are both sources of efficiency and points of fragility.
The value of these analyses lies not in producing a definitive ranking, but in providing a repeatable measurement method: turning intuitions like "the AI industry is very concentrated" into verifiable structural indicators.
Centrality is a family of indicators used in network analysis to measure node importance. Common degree centrality counts the number of direct connections a node has; betweenness centrality measures how many shortest paths between other pairs of nodes pass through a node, thus identifying "bridge" roles; eigenvector centrality gives higher weight to nodes connected to important nodes. In this study, centrality analysis helps identify organizations that span multiple layers—chips, cloud, models, and capital. They may not hold the largest share in any single market, but they possess structural influence due to connections to many heterogeneous nodes. Applying these indicators to organizational relationship networks transforms the vague judgment of "who matters in the AI ecosystem" into a reviewable topological measure.
Community detection is a class of algorithms that partition a network into densely connected subgroups; common methods include the modularity-optimization-based Louvain algorithm and the Leiden algorithm. In the context of this study, communities may correspond to compute-model alliances formed around a cloud provider, or clusters of startups linked by the same group of investors. After identifying communities, further examining the edges connecting different communities can locate "chokepoint bridges"—these bridging organizations facilitate resource flows under normal conditions but become transmission nodes for cascading failures during disruptions. The combination of community and chokepoint identification enables the map not only to describe static structure but also to highlight dynamic risks.
The Map Is Incomplete, but the Direction Is Right
The authors acknowledge that the dataset is "quite comprehensive but necessarily incomplete": public documents do not record private transactions, and coverage is also influenced by search design. This is important—if readers treat the map as the full picture of the industry, they may overestimate some publicly active organizations and underestimate low-profile but critical participants.
A more reasonable use is to treat it as a baseline: identify obvious chokepoints and dependencies, then verify with first-hand research. For policy researchers, it provides structural evidence missing from discussions of AI governance; for companies and investors, it highlights hidden exposures in the supply chain; for academic peers, it is a starting point that can be criticized and improved.
Moving the AI supply chain from "roughly known" to "measurable" is itself a substantive step forward.
One-line Summary
A new study maps the organizational relationship network of the AI supply chain, using datasets and structural indicators to measure concentration and chokepoint risks.
Paragraph Summary
A new study attempts to systematically map the organizational relationship network in the AI supply chain, covering flows of models, data, chips, infrastructure, capital, and talent, rather than merely a layered technical stack diagram. The study points out that the information gap creates six types of problems: market concentration, power imbalance, single-point chokepoints, cascading failures, fragmented accountability, and systemic risk. The team built a pipeline to extract organizational relationships from public information, produced a multi-layer large-scale dataset and made it public on Hugging Face, and identified key nodes and chokepoints through centrality, concentration, and community analysis. The authors acknowledge that the data is limited by public information and necessarily incomplete, and recommend using it as a baseline combined with first-hand research verification, providing measurable structural evidence for AI governance, corporate risk management, and academic research.
Related articles
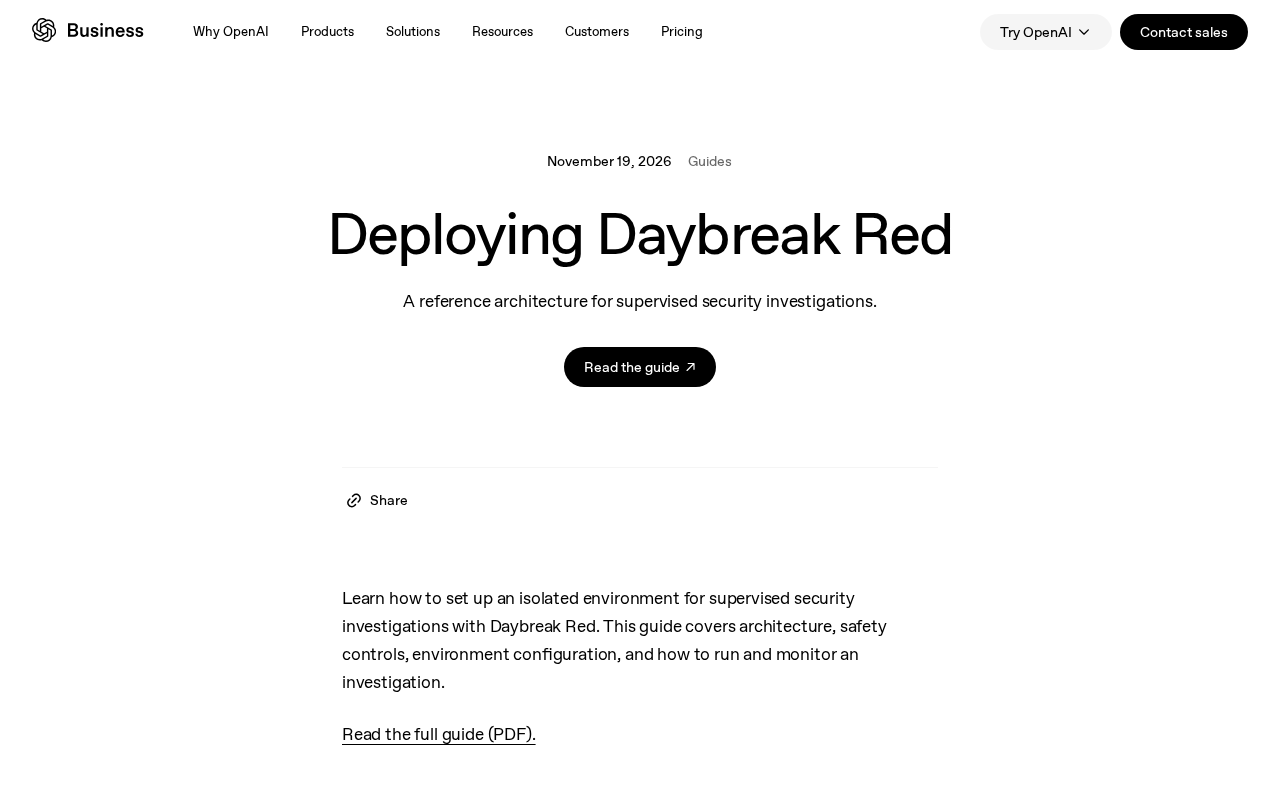
Daybreak Red Deployment Guide: A Reference Architecture for Supervised Security Investigation
A breakdown of the Daybreak Red reference architecture: security control design, deployment configuration process, and runtime monitoring for supervised security investigation.
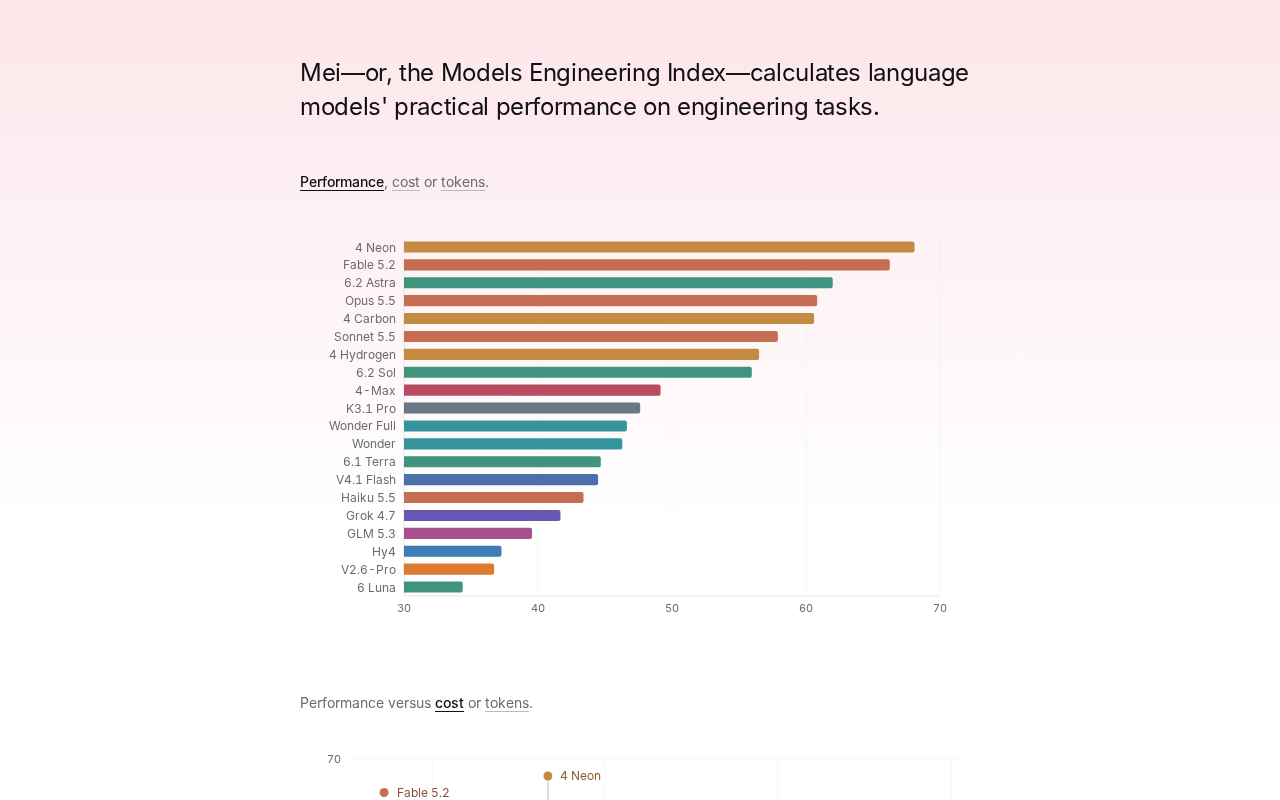
Gemini 4 Neon Tops the Models Engineering Index
Gemini 4 Neon tops the Models Engineering Index, sparking Hacker News debate over ranking credibility and evaluation methods. Here's what it means for developers.

Apple's Self-Developed AI Agent: An Agent That Can Operate Your Mac Is Coming
Apple is reportedly developing an AI agent that can operate a Mac, targeting Meta Muse, Claude, OpenAI Dots, and others. This article analyzes Apple's system-level advantages, the competitive landscape, and likely rollout paths in the agent race.