Big Tech AI Engineering Interview: Full-Chain Observability from Frontend Monitoring to Agents

A three-layer progressive system from browser performance monitoring to AI Agent optimization, and then to full-chain observability.
The article revolves around frontend AI position interviews, breaking down the monitoring system from the browser to the AI pipeline. The first layer is the frontend monitoring foundation: PerformanceObserver collects metrics like LCP, INP, and CLS; exception capture relies on onerror and unhandledrejection; the transport layer handles batch merging, failure retry, and trace ID propagation. The second layer is AI Agent optimization across effectiveness, cost, and stability: every RAG step can be optimized; summary compression cuts 747 tokens to about 280; multi-agent collaboration has serial, parallel, and debate forms, extending to Agentic RAG and Graph RAG. The third layer is full-chain observability, metricizing each layer and fusing Sentry-style exception clustering with LangSmith-style model call analysis into a closed loop of monitoring, clustering, tracing, and fixing.
When interviewing for frontend positions, performance optimization and exception monitoring are classic questions. But when the role becomes "Frontend AI" or "AI Full-Stack," the scope of examination expands from the browser to the entire AI pipeline—from the user inputting a prompt, to every node and tool call inside the Agent, all the way to the final output—everything needs to be monitored. This article breaks down how this monitoring system goes from concept to code, organized around three progressively deeper layers of questions.
Layer One: The Foundation of the Frontend Monitoring System
How Performance Metrics Are Collected
The skeleton of frontend monitoring has three layers: the collection layer gathers performance, exception, resource, and tracking data through the SDK; the transport layer handles batch merging and queue-based reporting; the storage layer lands in a columnar database like ClickHouse, ultimately presented as real-time dashboards in the alerting layer.
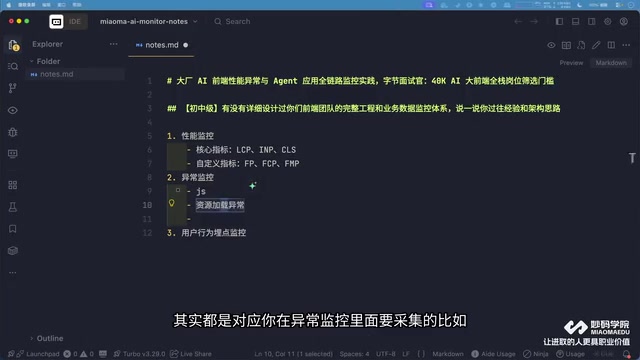
Core performance metrics include LCP (Largest Contentful Paint), INP (Interaction to Next Paint), and CLS (Cumulative Layout Shift). Take CLS as an example: an image initially occupies 100 pixels, then expands to 300 pixels after loading—those 200 pixels of layout shift are the source of the offset value. Beyond the core metrics, custom metrics like FP, FCP, FMP, TTFB, and TTI vary by team.
Collection relies on the browser-provided PerformanceObserver API. After subscribing to the corresponding entry types, you can retrieve values like startTime in the callback. The Web Vitals library encapsulates the collection logic for common metrics.
Web Vitals is a core web health measurement standard proposed by Google; LCP, INP, and CLS are three of its Core Web Vitals. They matter because they directly relate to the user-perceived loading speed, interaction smoothness, and visual stability, and they also affect search rankings. The Web Vitals library automatically subscribes to entry types like largest-contentful-paint, layout-shift, and event through PerformanceObserver, and normalizes the metrics, solving the problem of implementation differences across browsers. INP only officially replaced FID as a core metric in 2024; it measures the delay from user interaction to the next paint of the page, offering a more comprehensive reflection of interaction responsiveness.
The Two Key Entry Points for Exception Capture
JS execution exceptions are caught by listening to window.onerror, which captures synchronous errors in one sweep; rejections thrown by asynchronous tasks (such as Promise.reject) require the unhandledrejection event for separate capture—both are indispensable. Resource loading exceptions and API request exceptions require custom fetch wrapping for reporting; white screen detection can be determined by whether the top-level node appears within a specified time, and in strict scenarios, using MutationObserver to watch DOM changes is more reliable.
Business tracking covers three scenarios: exposure, click, and conversion. PV/UV, conversion funnels, and retention are common metric systems. Interestingly, different e-commerce products' handling of shopping carts—some downplay the cart, others emphasize favorites—reflects product decisions driven by tracking data analysis.
Engineering Details of the Transport Layer
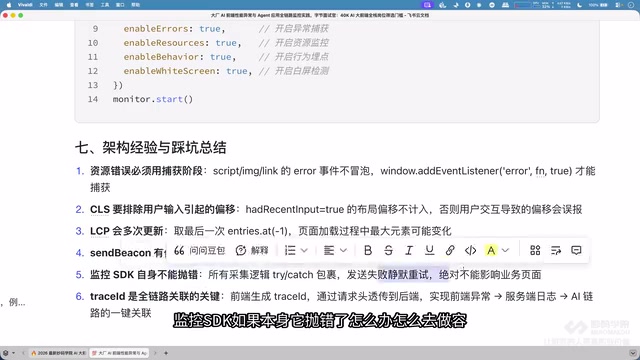
After SDK-collected data enters the upload queue, it needs to handle batch merging, failure retry, size limits, fault-tolerant degradation when the SDK itself throws errors, and how trace IDs run through the entire pipeline. These details are precisely what demonstrates architectural experience in an interview.
Layer Two: Optimization Dimensions of AI Agents
Discussions of Agent optimization can be broken down into three aspects: effectiveness, cost, and stability. The RAG pipeline is an unavoidable sample: document loading (including multimodal processing) → chunking → vectorization → storage → similarity retrieval → reranking → concatenation and generation. Every step is an optimization point—whether to choose pgvector or Milvus for the vector database, how to balance full-text and vector in hybrid retrieval, whether to use a cross-encoder or bi-encoder for reranking—all directly affect the final quality.
Context Engineering: Compression Is More Direct Than You Think
The longer the prompt, the less the model remembers key information—and the higher the token cost. One core technique of context engineering is conversation summary compression: hand the conversation that's approaching the window limit to the model, asking it to preserve facts, goals, constraints, and to-dos. In testing, a 747-token passage compressed to about 280 tokens—over 26% compression—with key information essentially intact.
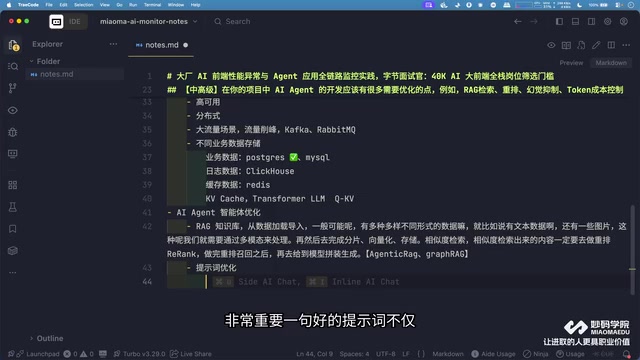
A sliding window that keeps the most recent N turns is a more brute-force approach; the cost is potentially losing early key information, so summary compression is generally preferred.
Three Forms of Multi-Agent Collaboration
Serial, Parallel, and Debate are the foundational modes of multi-agent collaboration, while the Supervisor main-agent pattern is common in complex task orchestration. For example, the scenario of "generating a design in one sentence, then generating code with one click" involves a main agent directing several sub-agents to work in parallel on module designs like the navigation bar, content area, and brand story.
Advanced forms of RAG are also worth noting: Agentic RAG gives the retrieval process autonomous decision-making capabilities; Graph RAG replaces linear chains with graph structures, abstracting complex business processes into nodes and branches, making retrieval-augmented results more aligned with expectations.
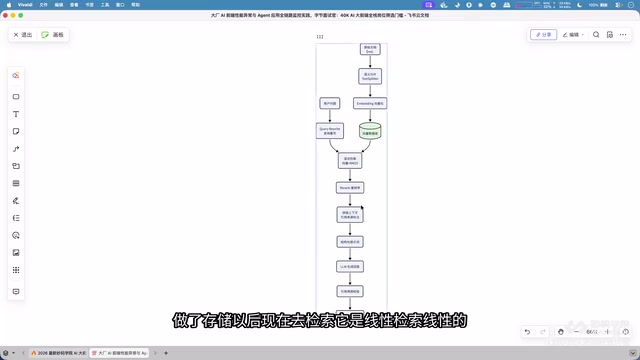
The key difference between Agentic RAG and traditional RAG is that the retrieval process introduces autonomous decision-making: the model judges whether retrieval is needed, what to retrieve, whether to retrieve multiple times, and when to stop—rather than rigidly following a "single retrieval → generation" flow. Graph RAG organizes knowledge into a graph structure of entities and relationships, traversing the graph during retrieval, enabling answers to questions requiring multi-hop reasoning, such as "Which university did the CEO of Company A graduate from?" Both improve accuracy in complex scenarios, but at the cost of higher latency and expense, so trade-offs must be made based on business scenarios.
Layer Three: Full-Site AI Full-Chain Observability
Metricization Is the Key Action
The frontend, server-side, and AI-layer optimizations discussed earlier must all be converted into measurable metrics when they land in the monitoring system. Caching looks at hit rates and avalanche warnings; high availability looks at the health of distributed clusters; traffic peak shaving looks at the pressure-bearing performance of message queues (Kafka or RabbitMQ).
The AI layer needs to collect more granular metrics: latency from prompt to response in pipeline calls, token consumption, error rates (with categorized recording of rate limiting and timeouts), and model versions; the full RAG pipeline must record retrieval latency, recall counts and Top-K, order and score changes before and after reranking, and the hit rate of actually cited passages in answers; on the cost side, token consumption must be split across three dimensions—model, user, and task—with budget alerts set.
Benchmarking Against LangSmith and Sentry
A complete observability system needs to fuse two types of capabilities: Sentry-style exception clustering, Source Map restoration, and Issue and Release tracking; LangSmith-style model call analysis, full-pipeline token statistics, prompt version management with online editing, dataset evaluation, and execution replay. Only by combining the two can a closed-loop operations cycle be formed—from monitoring collection and fault clustering to intelligent tracing, AI diagnosis, and fix iteration.
In terms of engineering implementation, standardized templates are typically layered into an API layer (Controller), a service layer (Services), and a web layer, with business organized as Apps, Services, Packages, and Infrastructure. Infrastructure uses Docker Compose to orchestrate Kafka, ClickHouse, the vector database, the API service, and the web frontend in a unified way—one command brings up all services, and one command shuts everything down.
LangSmith is an LLM application observability and evaluation platform launched by the LangChain team; its core capabilities include tracing the inputs, outputs, and latency of each model call, managing prompt versions, and building evaluation datasets for regression testing. Sentry is a classic frontend exception monitoring platform, strong in error clustering, restoring stack traces via Source Map, and tracking issues by Release. The two target different stages of the pipeline—the former focuses on the quality and cost of LLM calls, the latter on code-level exceptions—and only by fusing them can full-stack issues be covered, from code errors to abnormal model outputs.
What's Truly Valuable to Express in an Interview
Stringing the above into a single sentence gives you your differentiated expression in the interview: led the design of a complete operations closed loop from monitoring collection and exception clustering to intelligent tracing, covering frontend performance, exceptions, and tracking, server-side caching and peak shaving, as well as token and RAG full-pipeline metrics at the AI layer.
Simply saying "I can use AI tools to write frontend code" versus being able to clearly explain the architectural trade-offs across the entire pipeline are completely different orders of magnitude in the interviewer's ears. AI lowers the cost of coding, but architectural thinking, pipeline understanding, and metric design are precisely the prerequisites for directing AI to do the work—for the same project, different people having AI implement it produces vastly different risk profiles.
One-line Summary
A three-layer progressive system from browser performance monitoring to AI Agent optimization, and then to full-chain observability.
Paragraph Summary
The article revolves around frontend AI position interviews, breaking down the monitoring system from the browser to the AI pipeline. The first layer is the frontend monitoring foundation: the collection layer uses PerformanceObserver to gather metrics like LCP, INP, and CLS; exception capture relies on the two entry points of onerror and unhandledrejection; the transport layer must handle batch merging, failure retry, and trace ID propagation. The second layer is AI Agent optimization, in three dimensions: effectiveness, cost, and stability: every step of the RAG pipeline can be optimized; context summary compression can reduce 747 tokens to about 280 tokens; multi-agent collaboration has three forms—serial, parallel, and debate—extending to Agentic RAG and Graph RAG. The third layer is full-chain observability, requiring metricization of each layer's capabilities and fusing Sentry-style exception clustering with LangSmith-style model call analysis to form an operations closed loop of monitoring, clustering, tracing, and fixing.
Related articles
AI Gains Confined to Tech? Non-Tech Industries See Little Payoff
Apollo analysis finds AI's economic returns remain highly concentrated in tech, with no quantifiable payoff yet in non-tech sectors. We break down the key arguments, Hacker News debate, and practical implications for enterprise AI investment and measurement.
FreeDNS: A Classic Choice for Free Dynamic DNS Services
FreeDNS is a platform offering free dynamic DNS hosting, supporting a shared domain pool and HTTP updates. This article covers its core features, community reviews, use cases, and comparisons with other DNS solutions.

AI Agents on Your Phone: Where's the Line Between Convenience and Privacy?
A developer finds people accept AI agents operating laptops but feel uneasy about phones. This article analyzes the trust gap behind data density, permission models, and observability, exploring the specific task boundaries users are willing to hand to mobile AI agents.