Building a Crypto Trading Bot with Python and Unity: A Visual Neon City

A Python trading bot and a Unity neon city turn six strategies' real-time performance into a watchable cyber landscape.
BinancyXBot is a Python crypto trading bot running on the Binance testnet or in paper mode with no real funds. It runs six strategies — EMA crossover, breakout, momentum, RSI dip-buying, Bollinger Band dip-buying, and a gradient boosting ML classifier — each with independent accounting and benchmarked against buy-and-hold. Every strategy is validated with walk-forward testing, scored out-of-sample with fees included. The Python side streams live prices and trades to a Unity neon city where each strategy is a skyscraper. Claude helped with coding, debugging, and shaders, with 3-minute candle tests planned next.
When a Trading Bot Becomes a Cyber City
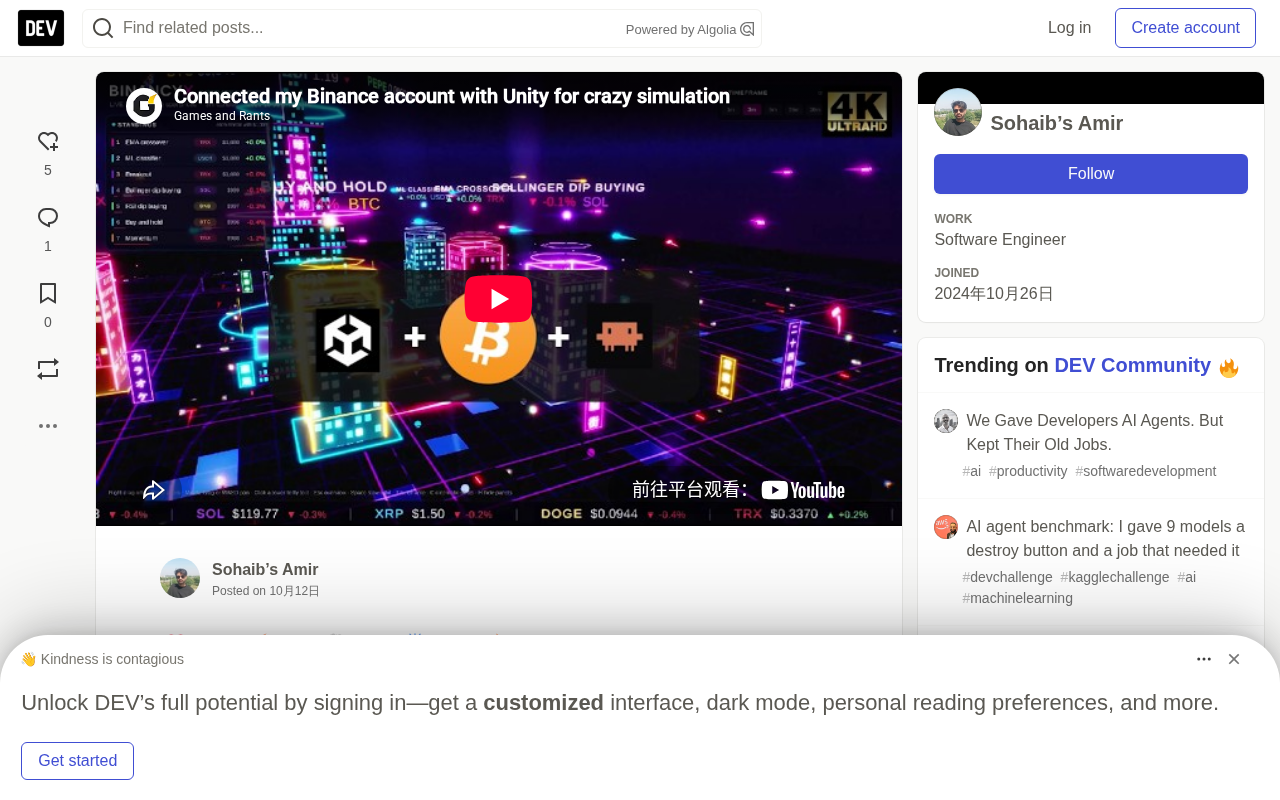
Most quantitative trading projects stop at flickering numbers in a terminal and backtest reports, but this developer turned BinancyXBot into a system you can actually watch — a cryptocurrency bot written in Python that trades autonomously on Binance, paired with a neon city built in Unity to watch every buy and sell in real time.
One thing needs to be clear up front: every dollar in this project is virtual. The bot is still in testing, doing paper trading or using the Binance testnet, with no real money involved. That's both a cautious choice and what makes the whole thing feel more like an experimental sandbox.
Six Strategies Competing on the Same Stage
The bot runs six strategies simultaneously, each with its own independent account:
- EMA Crossover: classic trend-following based on moving averages
- Breakout Strategy: captures price breaking through key levels
- Momentum Strategy: rides the trend
- RSI Dip-Buying: buys in oversold zones
- Bollinger Band Dip-Buying: mean reversion using the lower Bollinger Band
- Gradient Boosting ML Classifier: uses a machine learning model to predict direction
On top of that, a buy-and-hold baseline runs in parallel to measure whether the other strategies actually beat doing nothing at all.
Every strategy goes through walk-forward testing: parameters are chosen using historical data only, then scored on time periods it has never seen, with fees included. This matters — many backtests ignore trading costs, which inflates results, and factoring fees into scoring gives a more honest picture of how a strategy actually performs.
Walk-forward testing is a core method in quantitative strategy validation for fighting overfitting. Ordinary backtests often optimize parameters and evaluate performance on the same slice of historical data, so the strategy ends up "memorizing" history rather than learning patterns. Walk-forward splits the timeline into a sequence of consecutive "training window → test window" pairs: first find the optimal parameters on a training window, then apply those exact parameters to the immediately following test window for scoring, then roll the whole window forward and repeat. The final performance is aggregated from the out-of-sample results across all test windows, making it closer to live trading. Because every evaluation happens on data the parameters have never "seen," it exposes a strategy's dependence on specific historical periods to a large degree.
Gradient Boosting is a family of ensemble learning methods that trains many weak learners (usually shallow decision trees) sequentially, where each new tree fits the negative gradient of the residuals from all previous trees, gradually reducing overall error. Representative implementations include XGBoost, LightGBM, and CatBoost. In financial forecasting, it's often used to predict direction or returns from features like price, volume, and volatility. Compared to a single model, gradient boosting captures nonlinear relationships and feature interactions better, but it's also more prone to overfitting noise, which makes feature engineering, regularization, and out-of-sample validation especially critical — and that's exactly the problem walk-forward testing is designed to solve.
Turning the Trading Flow into a Neon Metropolis
The Python side pushes real-time prices and each strategy's trade flow to Unity. Each strategy becomes a skyscraper:
- Building height tracks changes in account equity
- Window lighting reflects its performance
- Neon strips show which coins it holds, turning red on drawdowns
At the center of the city stands an exchange tower with holographic halos and price boards. Every trade fires a beam between the exchange and the corresponding building: buys fly in, sells fly out. Rain, fog, bloom, and cinematic camera modes complete the visual package.
This visualization isn't just for show. When strategy performance is mapped to building height and lighting, the feedback loop between human and machine becomes more intuitive — you can see at a glance, from a strategy's "expression," who's making money and who's in drawdown.
Bloom is a post-processing effect in real-time rendering that simulates the glare of real camera lenses. It works by first extracting bright areas of the frame above a luminance threshold, then blurring those areas and blending them back over the original image, creating a soft glow around light sources. In Unity, bloom is part of the Post-Processing Stack and is often used alongside tone mapping — a key tool for building neon nightscapes and cyberpunk atmospheres.
Shaders are programs that run on the GPU and determine how each pixel or vertex is ultimately shaded. In Unity, Shader Graph is commonly used to author shaders visually through nodes, without writing HLSL by hand. Tweaking shaders in this project most likely means adjusting the glow intensity of neon strips, the logic that turns colors red on drawdowns, or the transparency and refraction of rain and fog. Binding these visual parameters to trading metrics is precisely the technical foundation that makes a "strategy's expression" readable.
Claude as a Coding Partner
The developer designed and led the project's direction while using Claude as a coding partner: it helped write parts of the walk-forward testing lab, debug trading logic, and adjust Unity shaders.
The next step is to rerun the entire test suite on 3-minute candles before any real money gets involved. Shorter timeframes mean more noise and a higher share of fees, which is a harsher test of a strategy's robustness.
This project shows an interesting path: quantitative trading doesn't have to be cold reports — visualization and aesthetics can become part of understanding complex systems.
One-line Summary
The developer turns six strategies' real-time performance into a watchable cyber landscape using a Python trading bot and a Unity neon city.
Paragraph Summary
BinancyXBot is a cryptocurrency trading bot written in Python, running on the Binance testnet or in paper mode with no real money involved. It runs six strategies simultaneously — EMA crossover, breakout, momentum, RSI dip-buying, Bollinger Band dip-buying, and a gradient boosting ML classifier — each with its own accounting, benchmarked against buy-and-hold. Every strategy goes through walk-forward testing, with parameters tuned only on historical data and scored on unseen periods with fees included, to check real robustness. The Python side pushes live prices and trade flows to a neon city built in Unity: each strategy is a skyscraper whose height tracks equity, whose lighting reflects performance, with trades flowing as light beams between the exchange tower and the buildings. The developer used Claude to assist with coding, debugging, and shader adjustments, and plans to rerun the full test suite on 3-minute candles next.
Related articles

Random Pruning of the DPO Computation Graph: 1.4x Training Speedup and Lower Peak Memory
DPO training too slow and memory-hungry? This paper proposes a random pruning framework for the DPO computation graph, sampling independently across position, sequence, and branch dimensions; branch pruning achieves a 1.426x step-time speedup and cuts training time by about 30%, with in-depth attribution of memory and time gains.

Why Does JEPA Underperform MLM in Longitudinal EHR Representation Learning?
New study compares JEPA and MLM for longitudinal EHR representation learning on MIMIC-IV: three JEPA variants train stably without collapse but underperform MLM; target size, not heterogeneity, drives prediction error.

Transfer Learning + Visible Light Communication: A New Approach to Energy-Efficient Indoor Positioning
A study proposes a transfer learning-based visible light communication indoor positioning method, achieving 47% accuracy improvement on the BOSCH factory dataset, 67.5% model efficiency under high noise, and introducing the ME composite metric for energy-efficient positioning in energy-constrained industrial IoT scenarios.