Building a Map Projection Conversion Tool with AI: Animated Comparison of Mercator and Equal-Area Projections
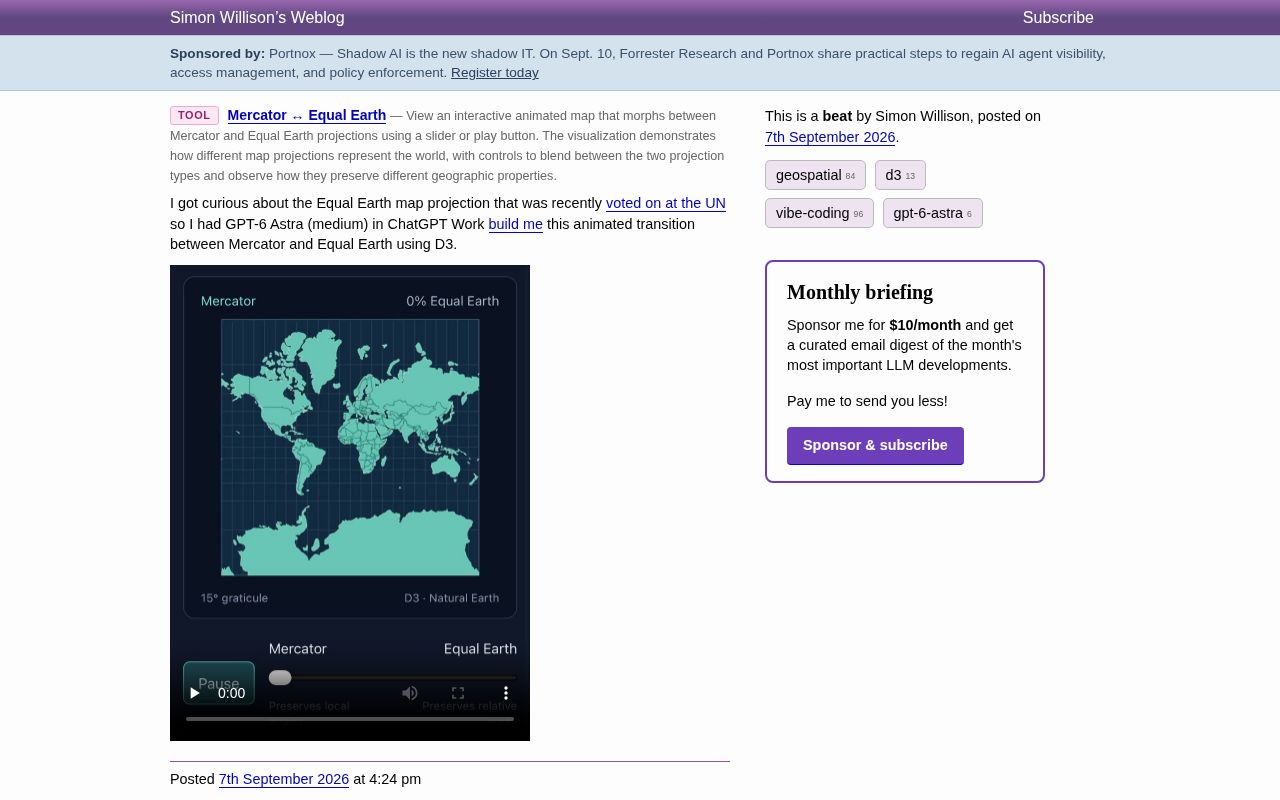
AI-powered D3.js tool animates the transition between Mercator and Equal Earth map projections.
Developer Simon Willison used ChatGPT to rapidly build a D3.js-based animated tool that visually transitions between Mercator and Equal Earth map projections. Inspired by a UN vote on map projection standards, the project demonstrates how AI-assisted "vibe coding" enables fast prototyping of professional geospatial visualizations, making complex cartographic concepts accessible to a wider audience.
A UN Vote Sparks an Exploration of Map Projections
The United Nations held a vote on world map projection standards, with Equal Earth becoming a focal point of discussion. Compared to the traditional Mercator projection, this projection method more accurately represents the true area proportions of continents — particularly addressing the long-criticized issue of Africa being significantly shrunk on Mercator maps.
The choice of map projection has never been purely a technical matter — it profoundly shapes humanity's spatial cognition and political imagination. In 1974, German historian Arno Peters publicly criticized the Mercator projection as a product of "Eurocentrism" — visually enlarging Europe and North America at higher latitudes while shrinking developing countries in the tropics and Southern Hemisphere. While the Gall-Peters projection promoted by Peters corrected the area problem, it drew criticism from the cartographic community for severely stretching and distorting continental shapes. This "map war" continues to this day, and the UN's vote on map projection standards is an extension of this long-running debate into the realm of international governance, reflecting the deeper implications of maps as tools of power discourse.
After learning about this news, developer Simon Willison had an intuitive idea: could an animation visually demonstrate the differences between the two projections? Using ChatGPT, he quickly built a D3.js-based animated conversion tool that achieves a smooth transition effect between Mercator and Equal Earth projections.
The Complete AI-Assisted Development Workflow
This project is a textbook example of "vibe coding" — where a developer describes requirements in natural language, and an AI assistant interprets the intent and generates runnable code. The term "vibe coding" was coined by Andrej Karpathy (OpenAI co-founder and former Tesla AI Director) in February 2025 to describe an entirely new programming paradigm: developers fully immerse themselves in the "vibe," describe their intent to AI in natural language, review the results, and iteratively refine through conversation — with virtually no manual code writing or review throughout the process. This approach is fundamentally different from traditional "AI-assisted programming" (such as GitHub Copilot's code completion), which still requires developers to have full code comprehension. Vibe coding is more like reducing programming to a form of "conversational creation." It's particularly well-suited for one-off prototypes, personal tools, and exploratory projects, though concerns around maintainability and security remain for production-grade systems.
The entire process highlights several core advantages of AI-assisted programming.
Rapid Prototype Validation: From Idea to Tool at Lightning Speed
Under a traditional development approach, building a map projection conversion tool like this would require multiple steps: reading through D3.js's geographic projection API documentation, studying the mathematical principles behind Mercator and equal-area projections, and writing the projection interpolation animation logic. With AI assistance, these technical details are highly abstracted — developers only need to describe a high-level requirement like "build an animated transition from Mercator to Equal Earth" to receive a functional code framework.
Zero-Barrier Access to the D3.js Professional Library
D3.js (Data-Driven Documents), created by Mike Bostock in 2011, is a JavaScript data visualization library built on web standards (SVG, Canvas, HTML). It's widely recognized as one of the most powerful tools in the data visualization field, but it comes with a notoriously steep learning curve. Its geographic projection module (d3-geo) includes dozens of built-in map projection algorithms, each implementing forward and inverse transformations from geographic coordinates to screen pixel coordinates. D3's projection system employs a streaming geometry processing pipeline: GeoJSON data passes through projection transformation, clipping, and adaptive sampling steps before generating SVG path strings.
AI models have a deep built-in understanding of D3.js and can directly generate code that follows best practices, including projection function calls, SVG path generation, and animation control logic. This dramatically lowers the technical barrier, enabling non-visualization experts to create professional-grade map applications.
Democratizing Geospatial Technology
Map projections involve complex geodesy and geospatial computation, but through AI toolchains, this specialized technology becomes far more accessible. Developers can build interactive, educationally valuable visualization tools without needing to deeply understand the mathematics of sphere-to-plane mapping.
Core Technical Implementation Details
The map projection conversion tool's core technology stack consists of three key components:
D3.js Geographic Projection Module
D3 provides a rich set of map projection methods. This tool primarily uses two projection functions: d3.geoMercator() and d3.geoEqualEarth(). A custom interpolation function enables smooth transition calculations between the two sets of projection parameters.
To achieve animated transitions between the two projections, the technical approach requires computing output coordinates from both projections simultaneously for each geographic coordinate point, then performing linear blending between the two sets of coordinates using an interpolation parameter t (ranging from 0 to 1). This means recalculating all path vertex positions for every frame — a considerable computational load — which is precisely why D3.js's efficient rendering pipeline is critical for this type of application.
Animation Transitions and Easing Control
D3's transition API provides precise control over animation duration and easing functions, making the morphing process from Mercator to equal-area projection smooth and natural. The key technical challenge lies in continuously interpolating projection parameters to ensure that intermediate frames produce reasonable map shapes without tearing artifacts.
Interactive User Controls
Users can manually control animation playback and pausing through interface controls, observing the differences between the two projections frame by frame. Key areas to watch include Africa, Greenland, Antarctica, and other regions whose areas are significantly distorted under the Mercator projection.
Mercator Projection vs. Equal Earth Projection: The Area Distortion Problem
The Mercator Projection was invented by Flemish cartographer Gerardus Mercator in 1569. Its core mathematical principle is conformal cylindrical projection — projecting the Earth's surface onto a cylinder tangent to the equator, then unrolling it into a flat plane. In its mathematical formulation, the scaling factor in the latitude direction is sec(φ) (where φ is latitude), meaning vertical stretching grows exponentially with increasing latitude, approaching infinity at the poles. This property makes it extremely useful for navigation — rhumb lines (lines of constant bearing) between any two points appear as straight lines on the map, allowing sailors to determine headings with just a ruler and protractor. However, it is precisely this mathematical constraint of angular fidelity that causes severe area distortion.
Due to its angle-preserving advantages in maritime navigation, the Mercator projection has dominated world maps for centuries. However, it has a well-known and serious flaw: areas at high latitudes are dramatically exaggerated.
The most classic example is the comparison between Greenland and Africa: on a Mercator map, Greenland appears roughly the same size as Africa, when in reality Africa is 14 times larger (Africa is approximately 30.2 million km², Greenland approximately 2.16 million km²). Similarly, Alaska appears roughly the same size as Brazil on a Mercator map, but Brazil's actual area is more than 5 times that of Alaska. This visual misleading has long influenced people's perception of the world.
The Equal Earth projection was proposed in 2018 by three cartographic scholars — Bojan Šavrič, Tom Patterson, and Bernhard Jenny — and published in the International Journal of Geographical Information Science. It is a pseudocylindrical equal-area projection designed to minimize shape distortion and maintain visual aesthetics while strictly guaranteeing area equivalence. Its mathematical formula is relatively concise, defined by a set of polynomials that are computationally efficient and well-suited for real-time rendering in digital environments. It is considered an elegant compromise between the previously popular Robinson projection (not strictly equal-area) and the Gall-Peters projection (equal-area but with severe shape distortion). By maintaining visual appeal while more accurately reflecting the true area proportions of continents, Equal Earth holds significant practical importance for scenarios such as global resource allocation discussions, climate change impact assessments, and international development issues.
The Role of AI Tools in Technical Creation
This case clearly demonstrates AI's positioning as a "technology amplifier." The developer retains creative leadership and problem-definition capabilities, while AI handles code implementation at the execution level. This human-AI collaboration model is particularly well-suited for the following scenarios:
- Educational tool development: Rapidly converting teaching ideas into interactive online demonstrations
- Data visualization prototyping: Validating visual approaches before formally launching a project
- Cross-domain technical exploration: Allowing developers outside a specialized field to experiment with new technologies at low cost
Notably, Simon Willison publicly shared the complete ChatGPT conversation transcript. This transparent AI collaboration process is itself a valuable learning resource, helping other developers master effective communication techniques for working with AI. Simon Willison is a well-known open-source developer and co-creator of the Django web framework. He has long been an advocate for AI-assisted programming practices, documenting numerous experiments using large language models for software development on his blog.
From Professional Tools to the Democratization of Technology
From the UN's map projection vote to an individual developer's rapid response, the creation of this small tool reflects the broader trend of technology democratization. When AI dramatically lowers the barrier to professional skills, more people can participate in technical creation and quickly transform inspiration into usable products. Even niche professional topics like map projections can gain broader public attention and understanding as a result.
The deeper significance of this trend is that the bottleneck in technical creation is shifting from "can it be built" to "is it worth building." When implementation costs approach zero, what becomes truly scarce is valuable problem awareness and creative intuition — just like Simon Willison's flash of inspiration upon seeing the UN news, and the drive to transform it into a public educational tool.
Key Takeaways
Related articles

Knockin': AI Business Cards That Make Your Personal Bio Intelligent
Knockin' transforms traditional bios into interactive AI business cards where visitors can chat to learn about your expertise and book meetings directly.

Intel CPU Price Increase of 10%: Strategic Transformation and Market Impact Analysis
Intel plans to increase PC processor prices by ~10%, shifting from market share competition to profit-focused strategy. Analysis of price increase drivers, impact on consumers and OEMs, AMD competitive dynamics, and industry trends.

Switch Open Source Tool: Bringing AI Agents into Team Collaboration Platforms
Switch is an open source tool that integrates AI Agents as named participants into Slack, Teams, Discord, and other collaboration platforms, supporting multi-framework compatibility and self-hosted deployment. It reached #1 on Product Hunt.