C++26's New Debugging Header: Standard Library Finally Gets Built-in Debug Support

C++26 introduces the standard <debugging> header, giving C++ portable breakpoint and trap debugging primitives for the first time.
C++ has long lacked unified debugging infrastructure, forcing developers to rely on assert macros, compiler built-ins, or platform-specific APIs—solutions that are either limited or non-portable. C++23's <stacktrace> solved call stack capture, but more fundamental debugging primitives like breakpoint triggering were still missing. C++26's planned <debugging> header fills this gap by providing standardized breakpoint and trap mechanisms unaffected by NDEBUG, ensuring availability in all build configurations. It doesn't replace debuggers or logging, but lets code express debugging intent, offering portable debugging hooks for cross-platform projects and template library authors. The community is generally positive, though concerns exist about confusion with compiler-specific solutions.
The C++ Standards Committee is introducing a brand-new <debugging> header for C++26, marking the first time the standard library has formally incorporated debugging support into the specification. For C++ developers who have long relied on third-party libraries or platform-specific APIs, this is a signal worth paying attention to.
Why C++ Needs Standardized Debugging Tools
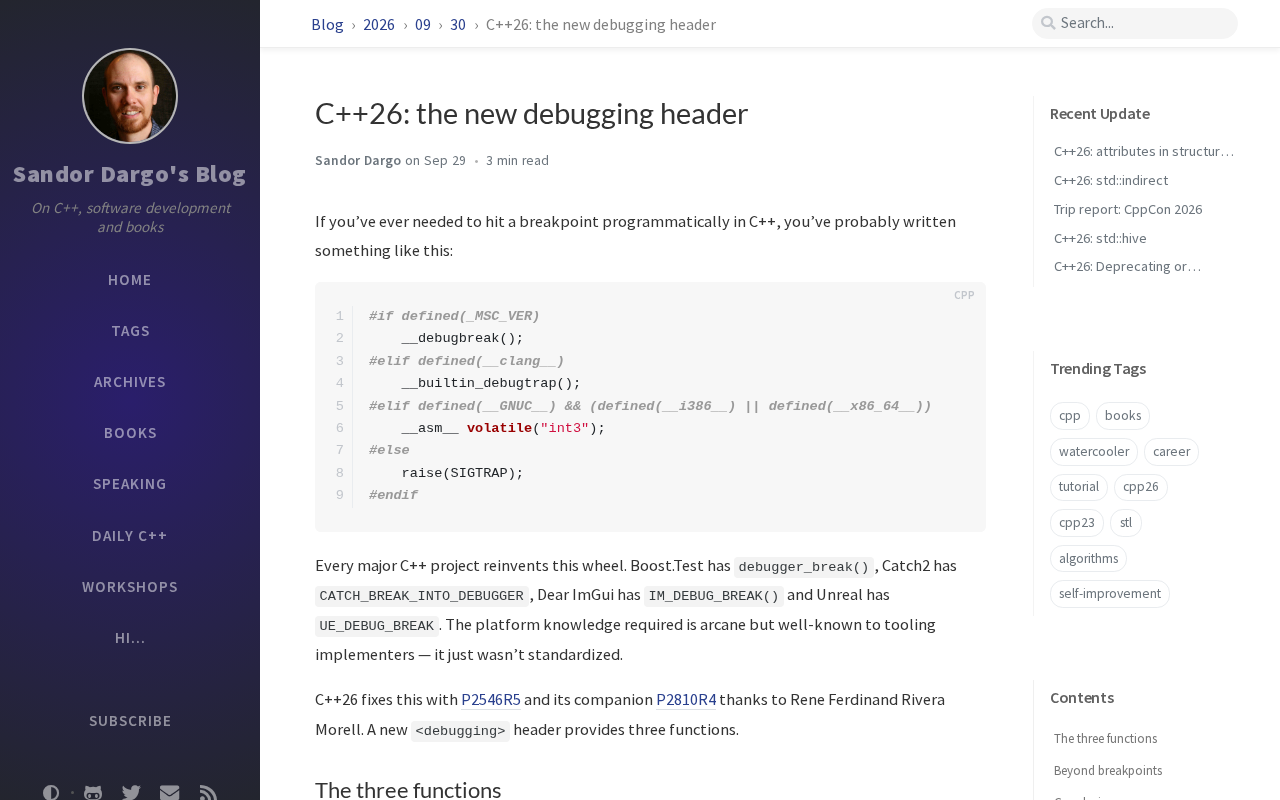
C++ has long lacked unified debugging infrastructure. When developers want to assert in code, print a call stack, or trigger a breakpoint, they typically have to rely on the assert macro, compiler built-ins (such as __builtin_trap), or platform APIs (such as Windows' DebugBreak or Linux's raise(SIGTRAP)). These approaches are either limited in functionality or non-portable.
The standard library didn't introduce <stacktrace> until C++23, which solved the problem of capturing call stacks. But more fundamental debugging primitives—breakpoint triggering, conditional debugging—were still missing. C++26's <debugging> header is designed to fill this gap.
<stacktrace> is a standard library component introduced in C++23, defined in the <stacktrace> header, used to capture and traverse call stacks at runtime. It is based on C++'s std::stacktrace_entry and std::basic_stacktrace classes, and can retrieve function names, source file names, and line numbers in a cross-platform manner. Before this, developers who wanted to obtain call stack information typically had to rely on platform-specific APIs (such as Linux's backtrace(), Windows' CaptureStackBackTrace) or third-party libraries (such as Boost.Stacktrace, Google Breakpad). The standardization of <stacktrace> solved the portability problem of call stack capture, but it only handles "recording" stack information—it does not provide the ability to "interrupt" or "trigger" debugging behavior. For this reason, more active debugging primitives such as breakpoint triggering and conditional debugging were still missing, and C++26's <debugging> header is designed specifically to fill this gap.
Core Features and Design Philosophy
Breakpoints and Traps
The core of the <debugging> header is to provide a standardized debugging interrupt mechanism. Unlike assert, debugging breakpoints should not be disabled by the NDEBUG macro—they should be available in all build configurations, allowing developers to precisely control when to pause program execution.
This is especially valuable for template library authors. When template instantiation exhibits unexpected behavior, library authors can place debugging breakpoints in the code, letting users decide whether to enable debugger capture themselves.
NDEBUG is a preprocessor macro in the C++ standard used to control the behavior of the assert macro. When NDEBUG is defined (typically in Release builds), the assert macro expands to a no-op, thereby avoiding the overhead of runtime checks. However, this design also means that debugging assertions completely disappear in release builds, making them unusable for debugging scenarios that need to exist in all build configurations. The breakpoint and trap mechanism provided by the <debugging> header is deliberately unaffected by NDEBUG, for the following reason: the semantics expressed by a debugging breakpoint are "this point requires debugger attention," not "this point should perform a runtime check." It should be explicitly controlled by the developer, not implicitly disabled by build configuration. This design allows template library authors to retain optional debugging hooks in their code even when users build in release mode, letting end users capture and analyze problems through a debugger when needed.
Relationship with Existing Tools
The new header is not intended to replace debuggers or logging systems. It solves a specific problem: allowing the code itself to express the intent "this needs debugging attention" without relying on platform-specific implementation details.
According to discussions on HN, the community is generally positive about this standardization effort, but some worry that it may cause confusion with existing compiler-specific solutions.
Compiler built-in functions are non-standardized low-level operation interfaces provided by compilers, such as GCC/Clang's __builtin_trap() (which generates an illegal instruction to crash the program or enter the debugger) and MSVC's __debugbreak() (which triggers a software breakpoint). These functions typically map directly to specific CPU instructions (such as x86's int3 or ud2), with extremely low performance overhead, but they are entirely dependent on compiler implementation and require conditional compilation when porting across platforms. The goal of the <debugging> header is precisely to unify these fragmented solutions into a portable standard interface. The community's concern about "confusion" mainly lies in: the new standard API overlaps semantically with existing compiler built-ins, and developers may not be clear about when to use the standard interface versus compiler-specific functions. Additionally, different compilers may implement <debugging> based on different underlying mechanisms, leading to subtle differences in debugger behavior—this is also an issue that needs to be weighed during the standardization process.
Practical Impact on Developers
Improved Portability
Cross-platform projects no longer need to write conditionally compiled debugging code for different operating systems. A single set of standard APIs can cover all platforms that support C++26.
A New Tool for Library Authors
Template library and framework authors can embed debugging hooks in a standard way without forcing users to accept a specific debugging solution. Users can choose to capture breakpoints in a debugger, log them, or ignore them entirely.
Adoption Pace
C++26 has not yet been officially released, and compiler support will take time. But the direction is clear: the C++ standard library is evolving from "minimally usable" to "developer-friendly," and debugging support is a key part of that.
Summary
The introduction of the <debugging> header reflects the C++ community's ongoing investment in developer experience. It won't immediately change how most people write code day to day, but it provides a long-missing standard tool for library authors and cross-platform projects. For developers following C++ evolution, this is a change in C++26 worth noting.
One-line Summary
C++26 will introduce a standard <debugging> header, providing C++ with portable breakpoint and trap debugging primitives for the first time.
Paragraph Summary
C++ has long lacked unified debugging infrastructure, with developers able to rely only on the assert macro, compiler built-ins, or platform-specific APIs—solutions that are either limited in functionality or non-portable. C++23's <stacktrace> solved the call stack capture problem, but more fundamental debugging primitives such as breakpoint triggering were still missing. The <debugging> header planned for C++26 is designed to fill this gap, with its core being a standardized breakpoint and trap mechanism that is unaffected by the NDEBUG macro, ensuring availability in all build configurations. This header does not replace debuggers or logging systems, but rather allows code itself to express debugging intent, providing portable debugging hooks for cross-platform projects and template library authors. The community is generally positive, though there are concerns about confusion with compiler-specific solutions.
Related articles

Random Pruning of the DPO Computation Graph: 1.4x Training Speedup and Lower Peak Memory
DPO training too slow and memory-hungry? This paper proposes a random pruning framework for the DPO computation graph, sampling independently across position, sequence, and branch dimensions; branch pruning achieves a 1.426x step-time speedup and cuts training time by about 30%, with in-depth attribution of memory and time gains.

Why Does JEPA Underperform MLM in Longitudinal EHR Representation Learning?
New study compares JEPA and MLM for longitudinal EHR representation learning on MIMIC-IV: three JEPA variants train stably without collapse but underperform MLM; target size, not heterogeneity, drives prediction error.

Transfer Learning + Visible Light Communication: A New Approach to Energy-Efficient Indoor Positioning
A study proposes a transfer learning-based visible light communication indoor positioning method, achieving 47% accuracy improvement on the BOSCH factory dataset, 67.5% model efficiency under high noise, and introducing the ME composite metric for energy-efficient positioning in energy-constrained industrial IoT scenarios.