Checkmk in Practice: Managing an Entire Home Lab with Free Open-Source Monitoring

Checkmk Community Edition builds unified home lab monitoring for free and lets AI take over alerting and configuration.
The article shows how to use the free, open-source Checkmk Community Edition to monitor Linux hosts, Docker containers, Windows machines, Proxmox VMs, UniFi devices, and web services in a home lab. It combines Agent, special Agent, and plugins; Docker uses the piggyback mechanism, network devices use SNMP scanning, and websites use HTTP rules. The plugin exchange and custom scripts extend monitoring to Plex, Home Assistant, and AI Agents. Alerts can go to Slack or become AI-remediated tickets, and an automation account lets AI bulk-add hosts and generate dashboards via API. The Community Edition requires manual steps; commercial editions automate them.
Title
Checkmk in Practice: Managing an Entire Home Lab with Free Open-Source Monitoring
The pain point of a home lab is never "nothing to monitor" — it's "too much stuff, too messy." Linux servers, Docker containers, Proxmox VMs, NAS, switches and APs, Plex, Home Assistant, plus a bunch of AI Agents that have recently popped up — any of them could silently die one day without you noticing. Checkmk Community Edition's answer is: pull all of this into one free, open-source platform, then let AI take over alerting and configuration.
What Checkmk Is and Why It's Worth Installing
Checkmk is an open-source monitoring system, free in its Community Edition. Its coverage is quite staggering: hosts, services, VMs, containers, network devices, websites, and even the output of your own scripts can all become unified monitoring items. According to a full hands-on demo by the YouTube channel NetworkChuck, it takes less than five minutes from download to up and running.
Its core mechanism stands on three legs: "plugins + Agent + special Agent." The Agent is installed inside the target machine and reports local data such as CPU, disk, and processes; a special Agent is not installed at all but actively pulls data via APIs (e.g., Proxmox, HTTP websites, UniFi controllers); plugins determine which services can be auto-discovered and brought under monitoring. The three can be stacked — the same host can run an Agent and also be configured with a special Agent, effectively observing it from both inside and outside.
The barrier with the Community Edition is that "you have to get your hands dirty": many advanced plugins are not enabled by default and require manual download, permission assignment, and configuration. That's the price of free, but once the workflow clicks, subsequent expansion is smooth.
Special Agent vs. Agent: A regular Agent runs as a daemon on the target host, actively collecting and pushing data; a special Agent installs nothing on the target host at all — instead, the Checkmk site periodically calls a local script to pull data through the target system's API (HTTPS, SNMP, database protocols, etc.). So special Agents suit devices where installing an Agent isn't convenient, such as network devices, virtualization platforms, SaaS services, and various Web APIs. The data it collects also goes through service discovery — it's just that the source is "pull" rather than "push."
Service Discovery: Checkmk doesn't assume in advance which monitoring items a host has. It first runs a discovery pass to enumerate all check items that the Agent or special Agent can actually report, then the user confirms which ones to bring under monitoring. The benefit is that when a host's role changes (new containers, newly mounted filesystems, newly started processes), you can rediscover and incrementally include them rather than adding each manually.
From Bare Metal to Containers: Three Typical Ways to Add Host Monitoring
The most basic integration is adding a Linux host. After entering the IP, Checkmk prompts you to install the Agent package for the corresponding distribution. Once installed, click "Test Agent connection" in the UI, and after it passes, run service discovery — it automatically lists every monitorable item on the machine, including anomalies identified by plugins. In the demo, an NFS service was immediately found to be in a critical state.
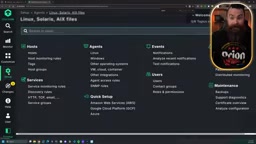
Docker monitoring requires an extra detour. Although the Agent can be installed and the host added, Docker container information depends on the mk_docker.py plugin, which the Community Edition doesn't enable automatically. The workflow: install the Python3-Docker dependency on the Docker host, download the plugin to the Agent's plugin directory and chmod +x it, generate a docker config file from the sample configuration, then re-run service discovery. Containers themselves also need to be attached to the parent host via the "piggyback" mechanism — create a new folder with no IP assigned and Agent disabled, set it to "always use and expect piggyback data," then bulk-import container names via CSV. It sounds tedious, but this logic lets container metrics be correctly attributed to the host machine.
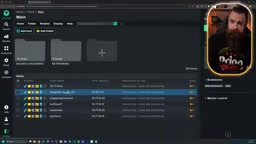
Windows is actually simpler: download the Agent installer directly from the UI, and if it can't connect after installation, it's usually the firewall not allowing it through — add a rule and restart the Agent service. In the demo, after connecting a Windows recording machine, problems immediately surfaced: NIC negotiation speed lower than expected, system disk nearly full, Windows Time service not running — hidden risks you'd never notice otherwise.
Piggyback Data Mechanism: In Checkmk, some monitoring data isn't reported by the monitored host itself but is "carried along" by another host — the data contains the name of the host it truly belongs to, and Checkmk attaches the metrics to that host accordingly. Docker containers are the typical scenario: container metrics are collected by the Agent on the host machine, but each data point is tagged with the container name, so you need to create a "piggyback host" for each container (no IP assigned, no Agent installed) and declare that it obtains information only from piggyback data. This way containers can have services, alerts, and views just like independent hosts, while the actual collection burden remains on the host machine.
Network Devices and Web Services: SNMP and HTTP Checks
Network devices rely on SNMP. Enable SNMP (v2 or v3) on the switch or controller, configure the community string, then create a network folder in Checkmk, enable subnet scanning, and enter the SNMP credentials. The scan automatically discovers devices in the subnet, and the UI pops up a "new hosts discovered" change notification — confirm it to bulk-add them. In the demo, after a 24-port UniFi switch was discovered, all interface statuses, CPU utilization, and uptime were immediately visible, including one port that had been online continuously for over a year — a classic case for a reboot.

Website monitoring goes through HTTP rules: create a rule, add an endpoint, enter the URL, and you can check the status code or search for a specific string in the page body — this trick guards against page tampering or hijacking. In the demo, changing the expected string to a nonexistent word immediately turned the service critical, and changing it back restored it. Proxmox, meanwhile, is accessed through its API (default port 8006) with a username and password, requiring nothing installed on the host machine, and you get data on VMs, storage, snapshot age, and more. After renaming the Docker host to match its name inside Proxmox, Checkmk can even recognize that "this Docker host is actually a VM" and add virtualization-layer metrics such as memory usage.
SNMP and community string: SNMP (Simple Network Management Protocol) is the most universal out-of-band management protocol for network devices, commonly supported by switches, routers, APs, and UPSs. Checkmk generates monitoring items by polling MIB objects on devices via SNMP (interface status, traffic counters, CPU, temperature, etc.). v2c uses a plaintext community string as the "password" — simple to configure but weak on security; v3 supports usernames, authentication, and encryption, suitable for environments with security requirements. During subnet scanning, Checkmk broadcasts SNMP requests to the subnet, and any device that responds with matching credentials is identified as a candidate host.
Plugin Ecosystem: From the Official Exchange to AI-Written Code
Built-in plugins only cover common scenarios; the real ceiling is the plugin exchange at exchange.checkmk.com. In the demo, the UniFi controller plugin was downloaded from the exchange and installed and enabled with mkp add and mkp enable (note: switch to the monitoring site user first), then rules were configured and service discovery run, revealing the performance of every SSID under each AP.
A more aggressive approach is having AI write plugins on the fly. In the demo, AI was asked to generate a script based on a Plex token to monitor "who's watching, what they're watching, and how many streams," then hooked in via the "Integrate Nagios plugins" rule as a command line — running within minutes. Similarly, Home Assistant (camera online count, entity count, light switches, air quality) and a self-built Hermes Agent were connected — the latter reporting cron status, gateway liveness, model login validity, usage metrics, and more through a custom script in the Agent's local script directory. This means: as long as you can write it as a script and output metrics, Checkmk can monitor it — the only limit is your imagination.
Checkmk Plugin Package (MKP): Plugins on the exchange are distributed as .mkp packages — essentially archives bundling check scripts, rule sets, WATO configuration, and metadata. Installation has two steps: mkp add registers the package with the site, and mkp enable activates its components; both must be run under the monitoring site user (usually the omd site user), otherwise file permissions and site paths won't match up. After enabling, you still need to configure the corresponding rules in the UI and re-run service discovery before the plugin actually produces monitoring items.
The Alerting Loop: From Slack Notifications to AI Auto-Remediation
Monitoring's value lies in alerting. Checkmk's notification rules support channels like Slack and Mattermost — just configure a webhook. In the demo, an Agent gateway was manually stopped, and about a minute later Slack received an alert; the recovery was also pushed when it came back.
The next step is turning alerts into tickets handed to AI. In the demo, a script pushed alerts for specified hosts and services to an AI IT department system, which generated tasks and had AI automatically perform remediation — restarting the gateway, confirming service recovery, all without human intervention. This closes the loop between "finding the problem" and "solving the problem."
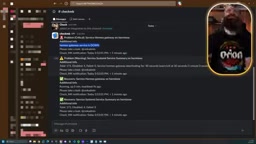
Finally, the reverse operation: give AI an automation account (automation secret, administrator role) so it can directly call the Checkmk API to bulk-add remaining hosts and generate custom dashboards. In the demo, AI onboarded all hosts in one go and generated an overview dashboard aggregating by issue. This effectively turns the monitoring system itself into a programmable object.
The Boundary Between Free and Commercial Editions
To be clear: although the Community Edition is fully functional, many automation steps must be done manually, such as bulk-importing Docker containers. Checkmk also offers three commercial editions — Pro, Ultimate (including the multi-tenant MT version), and Cloud — which automate these tedious steps. The official site also offers a free trial of Ultimate, free for up to 750 services per site — a fairly generous allowance for small-to-medium home labs.
Overall verdict: Checkmk isn't the kind of lightweight tool you install and forget — it requires you to understand the concepts of Agent, special Agent, plugins, and piggyback. But once set up, you gain complete visibility into your entire lab, and you can conveniently bring AI Agents into the same monitoring and automation system. For home lab enthusiasts who already have substantial infrastructure and don't want to pay for monitoring, this is probably the best value-for-money choice available today.
One-line Summary
Checkmk Community Edition sets up unified monitoring for your home lab for free, and lets AI take over alerting and configuration.
Paragraph Summary
The article explains how to use the free, open-source Checkmk Community Edition to unify monitoring of Linux hosts, Docker containers, Windows machines, Proxmox VMs, UniFi network devices, and web services in a home lab. The core mechanism combines three paths: Agent, special Agent, and plugins. Docker requires manually enabling a plugin and attributing container metrics via the piggyback mechanism; network devices use SNMP scanning; websites use HTTP rules. The plugin exchange and custom scripts extend monitoring to Plex, Home Assistant, and self-built AI Agents. Alerts can be pushed to Slack or turned into tickets for AI auto-remediation; with an automation account for AI, it can also call the API to bulk-add hosts and generate dashboards. The cost of the Community Edition is many manual steps, which the commercial editions automate.
Related articles

AI Coding Tools Emerge as a New Attack Surface: Fake Claude Extension Steals Developer Information
A fake Claude code extension appeared in the Cursor marketplace, affecting up to 5,000 developers in 11 hours, stealing host information and implanting SSH backdoors. Learn the attack methods, self-check steps, and security defense strategies for AI coding tools.

ChatGPT Switches to Token Billing in December: Chat and Codex Share Quota — Who's Most Affected?
ChatGPT switches to Token billing in December, with chat and Codex sharing quota. Simple questions can use Instant for free; heavy Codex users are most affected.

ChatGPT and Codex Merge Usage Allowances: Who Runs Out First?
OpenAI merges ChatGPT and Codex paid allowances into one shared token pool in December. We break down the details, token metering ambiguity, OpenAI's financial motives, and how users should respond.