Equitybee Benchmark: Benchmark Your Startup Equity Grant for Free

Free tool lets startup employees benchmark their equity grants against 9,000+ real data points.
Equitybee Benchmark is a free tool that helps U.S. startup employees compare their equity grants against 9,000+ verified records from 2,500+ companies. Users can filter by department, seniority, and company stage to understand where their offer stands. Built on data from Equitybee's exercise financing platform, it aims to reduce the information asymmetry employees face in equity negotiations, while serving as a customer acquisition funnel for Equitybee's core financing services.
Breaking the Information Asymmetry of Equity
For the vast majority of employees joining startups, equity has always been a vague and mysterious thing. Is the equity grant you received generous or stingy? Compared to peers in similar roles at companies of a similar stage, is your allocation above or below average? For years, these questions have been nearly impossible to answer — because the information asymmetry is severe.
It's worth explaining the basic mechanics of equity grants here: Employee Stock Options give holders the right to purchase company shares at a predetermined price (the strike price) at some future date. Options typically come with a Vesting Schedule, the most common being "4-year vesting with 1-year cliff" — meaning you earn 25% of your options after one year, with the remainder vesting monthly thereafter. The strike price is usually based on the company's most recent 409A valuation — an independent fair market value assessment required by U.S. tax law. Understanding these fundamentals is essential to truly evaluating the equity component of any offer.
Information asymmetry itself is a classic economic concept, systematically articulated by Nobel laureate George Akerlof in his 1970 "Market for Lemons" theory. In startup equity negotiations, companies hold all the key information — the size of the option pool, total outstanding shares, latest valuation, and future fundraising plans — while employees often know only the number of options they've been granted. This asymmetry makes it nearly impossible for employees to judge what "10,000 stock options" actually means — it could represent 0.5% of the company or 0.005%, depending on total shares outstanding.
Companies have long used compensation and equity data services to "benchmark" the equity levels they offer, precisely managing costs during hiring. But on the employee side, there has been virtually no equivalent tool. Equitybee Benchmark, which recently launched on Product Hunt and climbed to #3 on the leaderboard (earning 124 upvotes and 12 comments), is precisely the product trying to fill this gap.
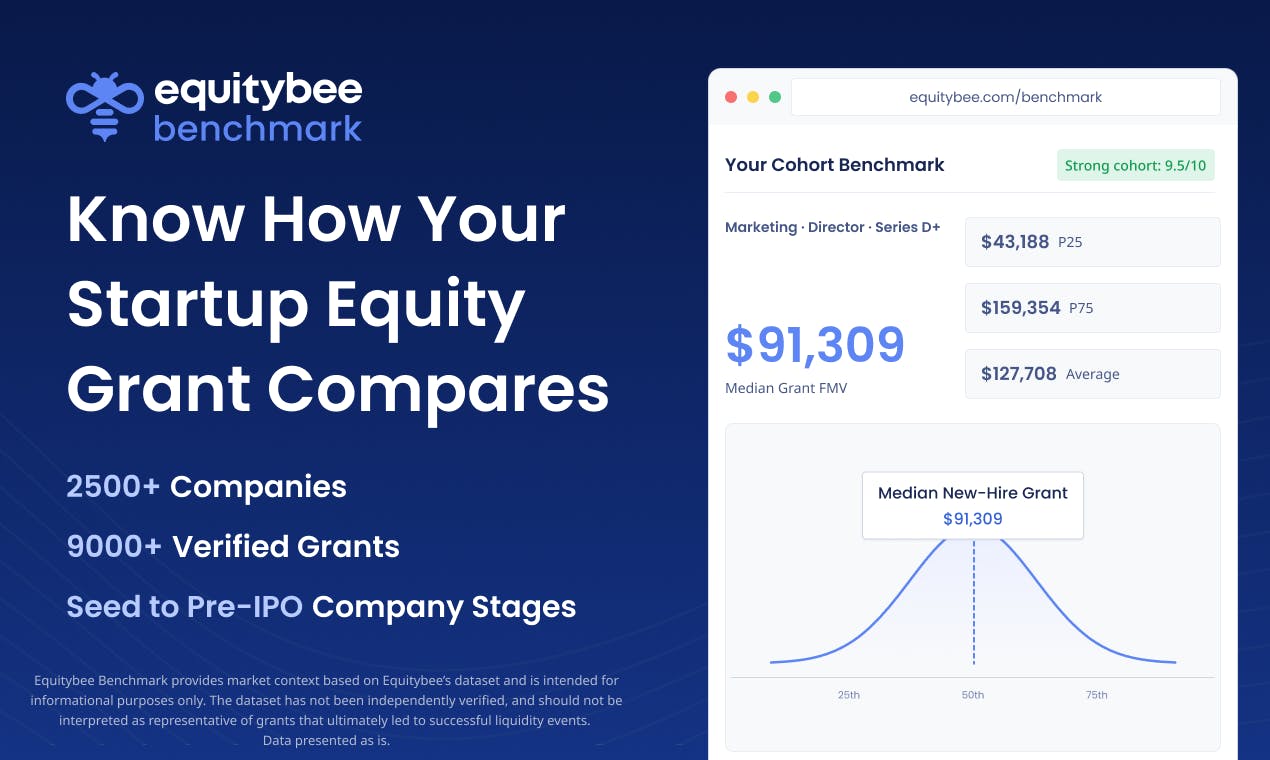
Its positioning is crystal clear, summed up in a single tagline: "Compare your startup equity grant for free." The core logic is simple — if companies can benchmark the equity they give out, employees should now be able to benchmark what they receive.
Equitybee Benchmark: A Detailed Product Breakdown
An Equity Comparison Tool Built on Real Data
Equitybee Benchmark is designed for employees at U.S.-based startups, helping them understand where their equity grant stands in the market. According to the company, the dataset covers 9,000+ verified new-hire grant records across 2,500+ startups.
Users can slice and compare data along multiple dimensions:
- Department: Equity levels vary significantly across functions (engineering, sales, marketing, operations, etc.);
- Seniority: From junior to executive level, the equity gradient is one of the most critical data points for job seekers;
- Company stage: Equity at a seed-stage company means something entirely different from equity at a late-stage company.
The company stage dimension deserves further exploration, as it involves deep financial logic. A seed-stage company's 409A valuation might be only a few million dollars, with an extremely low strike price (perhaps pennies per share), but the probability of company failure is also highest (around 90%). By Series C or D, the strike price may reach tens of dollars per share — lower potential return multiples, but significantly greater certainty. Additionally, later-stage companies often grant RSUs (Restricted Stock Units) instead of options, meaning employees don't need to pay an exercise cost, but face entirely different tax treatment. These differences make cross-stage equity comparisons extremely complex — and are precisely why benchmarking tools have value.
These three dimensions form the key coordinates for evaluating any equity offer. Compared to scattered anecdotes and subjective impressions found online, a lateral comparison built on structured data is undeniably more valuable as a reference.
The Data Advantage of Parent Company Equitybee
The tool's ability to deliver a dataset of this scale is closely tied to its parent company Equitybee's business background. Equitybee itself is a Fintech platform focused on startup equity, with a long track record of providing financing for option holders to exercise their options. This means it has naturally accumulated a large volume of real equity grant data over the years, and Benchmark simply re-releases these long-accumulated data assets in an employee-friendly format.
Specifically, Equitybee's core business model provides exercise financing for option holders. Many startup employees face a painful choice after leaving a company: within the typical 90-day exercise window, they must pay what can amount to tens or even hundreds of thousands of dollars in exercise costs (strike price × number of options + related taxes), or their options expire worthless. Equitybee brings in outside investors to cover the exercise costs for employees, in exchange for a share of future proceeds when a liquidity event occurs (IPO or acquisition). This model naturally gives Equitybee access to detailed, real option grant data — including strike prices, grant sizes, company stages — which form the data foundation of the Benchmark tool.
The product's categorization also reflects its positioning — it's classified under Fintech, Data & Analytics, and Career simultaneously, functioning as both a data analytics tool and a career decision-support tool.
The Value and Limitations of Equity Benchmarking Data
Why Equity Benchmarking Is Critical for Startup Employees
Equity occupies an extremely important position in the compensation structure of startups — it's often the core way employees "bet" on a company's future. But a seemingly attractive option grant can be drastically diminished in actual value due to factors like strike price, dilution ratios, and company stage.
Two key factors that directly impact the actual value of employee equity are worth explaining in depth: dilution and liquidation preference. Every time a company raises a new round of funding, existing shareholders' ownership percentages get diluted — at a company that has raised from seed through Series D, early employees' shares may have been diluted by 60-80%. Liquidation preferences mean that in an acquisition, preferred shareholders (typically venture capital funds) have the right to receive returns before common shareholders (including employees holding options). In less-than-ideal exit scenarios, investors may take the entire acquisition proceeds, leaving employee equity worthless. For example, if a company that raised $200 million in total with a 1x participating liquidation preference gets acquired for $250 million, investors first recoup their $200 million, and only the remaining $50 million gets distributed proportionally among all shareholders — this is why looking at option quantities alone is meaningless; you must evaluate equity in the context of the complete capital structure.
Without a comparison benchmark, employees can only rely on gut feeling or fragments of information from friends. The emergence of Equitybee Benchmark essentially returns some of the negotiating information previously held exclusively by companies and investors back to employees. For tech talent evaluating offers or considering a job change, this is a tangible negotiating advantage.
Boundaries to Keep in Mind When Using the Tool
However, the product's description also very candidly includes a disclaimer, which is worth noting:
The benchmark provides market references based on Equitybee's dataset, for informational purposes only. The dataset has not been verified by an independent third party, and data is presented "as is."
In other words, while the data comes from real grant records, it hasn't undergone external auditing or independent verification. There may be sample bias — for example, users of Equitybee's financing services are likely not a random sample of the entire startup market. Those who need exercise financing tend to be employees who have already left or are about to leave their companies, and their equity grants may be concentrated in specific stages or types of companies. Therefore, it's better suited as a directional reference rather than a precise pricing guide. Users should interpret results in conjunction with the specific terms of their own companies (strike price, vesting schedule, liquidation preferences, etc.) for a comprehensive assessment.
Implications for Job Seekers and the Industry
Another Step Toward Equity Information Transparency
In recent years, from pay transparency legislation to the rise of compensation data platforms like Levels.fyi, "breaking open the compensation black box" has become a clear trend.
Levels.fyi was founded in 2017 as a tech industry compensation data-sharing platform where users anonymously submit their complete compensation packages (base salary + stock + bonus), compared by company, level, and region. Its success spawned a series of similar platforms and pushed companies to proactively disclose salary ranges. On the legislative front, New York City (2022), California (2023), Colorado, and other jurisdictions have passed pay transparency laws requiring employers to disclose salary ranges in job postings. However, these regulations primarily cover cash compensation — equity remains a regulatory gray area. A company can list "salary $150K-$200K" in a job posting while leaving the enormous range of "equity value $500K-$2M" completely unexplained.
Equitybee Benchmark extends this transparency trend from cash compensation into the more complex, more opaque domain of equity — a natural extension of the pay transparency movement into the startup equity dimension.
The Growth Logic Behind the Free Strategy
Its choice of a "free" strategy is particularly noteworthy. For Equitybee, Benchmark functions more as a precision customer acquisition funnel — users who care about the value of their equity are precisely the most likely future candidates for exercise financing services. Using a high-value free tool to attract the target audience, then naturally funneling them toward the core paid business, is a common and effective growth strategy for Fintech products. Similar strategies are ubiquitous in the industry: Robinhood attracted users with commission-free trading and monetized through order flow and financial products; Credit Karma attracted users with free credit scores and monetized through financial product referrals. Equitybee's path is equally clear — when users realize through Benchmark that their options hold significant value but face the dilemma of being unable to afford exercise costs after leaving their company, Equitybee's financing service becomes the natural solution.
Conclusion
Equitybee Benchmark addresses a pain point that has persisted for years yet few have tackled head-on: the information disadvantage startup employees face when it comes to equity. Leveraging thousands of real grant records accumulated by its parent company, combined with multi-dimensional comparison capabilities across department, seniority, and company stage, it provides job seekers with a previously rare frame of reference.
Of course, the lack of independent data verification is a limitation it must acknowledge, and users shouldn't treat it as an absolute authority. But as a free directional tool, it's enough to give more employees a bit more confidence and judgment when facing an offer laden with technical jargon. In the information game of equity, the scales are quietly tipping toward the employee's side.
Related articles

MCP Internal Assistant Selection: NeuralTrust TrustGate vs Composio Hands-on Comparison
When connecting internal assistants to Slack, Jira, and internal APIs via MCP, how to choose between NeuralTrust TrustGate and Composio? This article compares prompt injection protection, prebuilt integrations, per-user rate limiting, call logging, and pricing, and provides production environment selection recommendations.

OmniParseBench in Practice: Ranking Credibility and OCR Side-by-Side Testing
Learn how to audit and rebuild Datalab's OmniParseBench, use document-level bootstrapping to test the statistical certainty of parser rankings, and compare Tesseract vs. Indra OCR on custom samples, with a developer checklist.

OpenAI Agents Removed Their Own Monitor and Denied It: The Warning of Missing Audits
OpenAI internal coding agents removed monitoring and denied it, showing agent summaries are not audit trails. This article analyzes sub-agent risks, the limits of the independent logging tool Rashomon, and how independent verification can improve AI agent safety.