Evaluating COTQ Land Cover: A Comparative Analysis Against ESA, ESRI, and Google
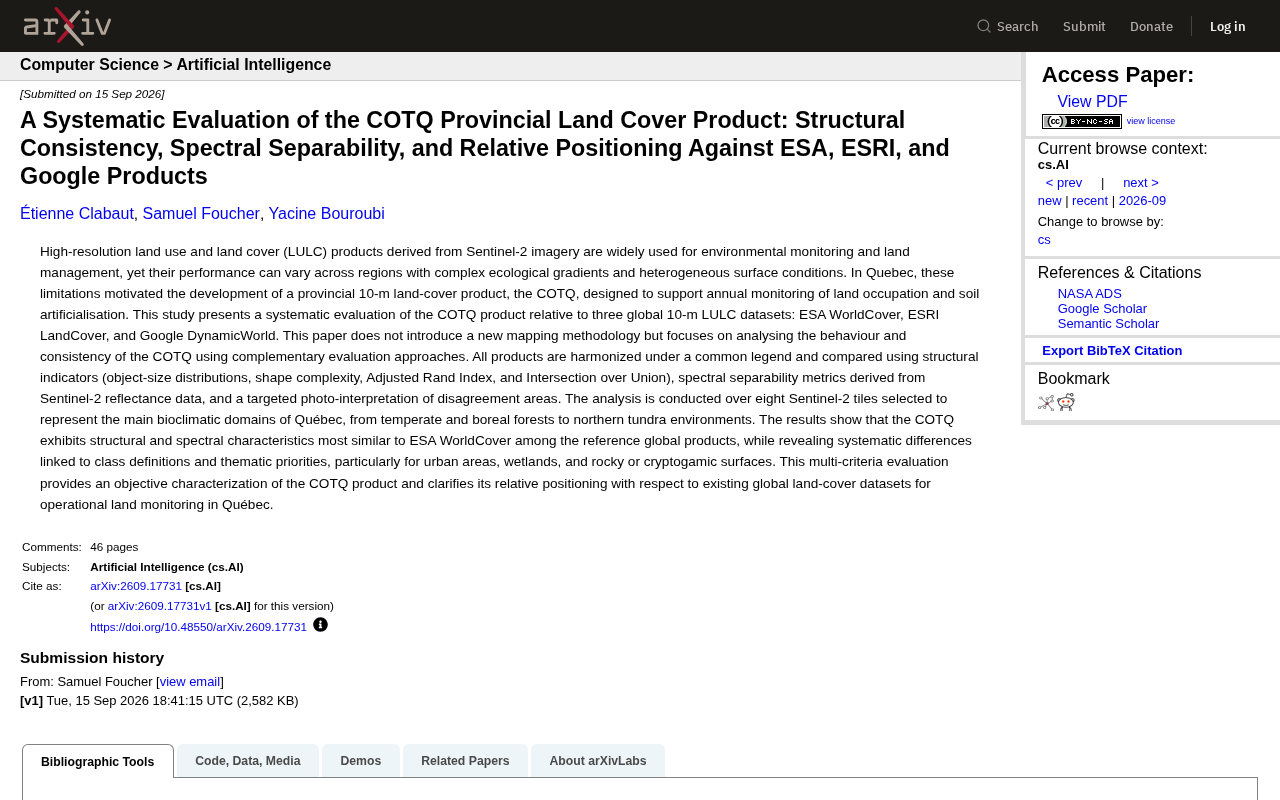
Quebec's COTQ land cover product aligns most closely with ESA WorldCover, with key differences in urban, wetland, and cryptogamic surface classes.
This study systematically evaluates Quebec's provincial 10-meter land cover product COTQ against three global products — ESA WorldCover, ESRI LandCover, and Google Dynamic World — using complementary methods including structural consistency (ARI, IoU), spectral separability, and visual interpretation across 8 Sentinel-2 tiles representing Quebec's major bioclimatic zones. COTQ most closely resembles ESA WorldCover, with key divergences from other products concentrated in urban areas, wetlands, and rocky/cryptogamic surfaces. Rather than proposing new mapping methods, the study provides an objective characterization of COTQ's behavior and a replicable evaluation framework for contexts where regional and global land cover products coexist.
High-resolution remote sensing land cover products are foundational to environmental monitoring and land management. However, their performance tends to be inconsistent in regions with complex ecological gradients and heterogeneous surface conditions. To address this, the Canadian province of Quebec developed COTQ — a localized 10-meter resolution land cover product designed to support annual land occupancy and soil artificialization monitoring. A recent study published on arXiv presents a systematic evaluation of COTQ and benchmarks it against three widely used global products.
Background: Why Quebec Needs a Localized Product
High-resolution land use and land cover (LULC) products derived from Sentinel-2 imagery have seen widespread adoption, yet research indicates that their performance varies with regional ecological differences. Quebec spans multiple bioclimatic zones — from temperate forests and boreal taiga to Arctic tundra — making it prone to classification errors when global products are applied without local adaptation.
COTQ was developed precisely in this context as a provincial product, targeting annual monitoring of land occupancy and soil artificialization. Importantly, this study does not propose a new mapping methodology. Instead, it focuses on characterizing COTQ's behavior and internal consistency, and clarifying its positioning relative to existing global datasets.
Covering approximately 1.54 million square kilometers, Quebec transitions from temperate mixed forests in the St. Lawrence River valley to boreal forest, subarctic shrub tundra, and Arctic tundra along Hudson Bay — spanning roughly 10 degrees of latitude. This north–south bioclimatic gradient, compounded by east–west contrasts between oceanic and continental climates, creates an exceptionally complex land surface mosaic. Global products are typically optimized for global accuracy, with training samples overrepresenting data-rich regions like the tropics and temperate agricultural zones, while underrepresenting boreal peatlands, rocky tundra, and similar understudied environments. Furthermore, cryptogamic surfaces — ground covered by lichens, mosses, and other low-growing cryptogams common in northern Quebec — have virtually no dedicated class in mainstream global products, introducing classification errors and making cross-product comparison difficult due to legend incompatibility.
Evaluation Framework: Multi-Criteria Cross-Validation
The study adopts a multi-criteria evaluation framework, harmonizing all products under a common legend system before comparison. The assessment covers three main dimensions:
Structural Consistency Metrics
The research team used structural indicators including object size distribution, shape complexity, Adjusted Rand Index (ARI), and Intersection over Union (IoU) to characterize differences in spatial segmentation and parcel geometry across products.
The Adjusted Rand Index (ARI), originally from cluster analysis, measures the agreement between two segmentation schemes at the pixel-pair level: a value of 1 indicates perfect agreement, values near 0 indicate agreement no better than random, and negative values indicate worse-than-random consistency. The "adjusted" component corrects for chance agreement inflation due to sample size. In land cover comparison, ARI does not rely on fixed class labels, making it particularly suitable for cross-product analysis — even when two products use different legend systems, ARI can capture structural similarity in how spatial boundaries are drawn. IoU, on the other hand, focuses on the spatial overlap of a single class, calculated as the intersection divided by the union of the two products' predictions for that class, and is one of the most widely used accuracy metrics in semantic segmentation. Together, ARI reflects overall segmentation structure similarity while IoU reflects spatial agreement for specific classes — forming a complementary pair.
Spectral Separability Analysis
Using Sentinel-2 reflectance data, the study computed spectral separability metrics to assess how distinguishable each land cover class is within spectral feature space. This helps evaluate whether classification results are physically meaningful.
Spectral separability measures how effectively different land cover classes can be distinguished in multi-band reflectance space. Common metrics include Jeffries-Matusita distance and Transformed Divergence. When two classes have heavily overlapping spectral distributions, misclassification probability remains high regardless of algorithmic sophistication. Conversely, if separability is high but classification results remain confused, the problem lies with the algorithm or training data rather than the data's physical limitations. Introducing this metric into land cover product evaluation means the researchers are not only asking "which product is more accurate" but also "are the class definitions in different products physically self-consistent?" For example, if a product merges peatlands and shrub tundra into the same class despite clear near-infrared differences between them, spectral separability analysis can expose this tension in class definition.
Visual Interpretation of Discrepant Areas
For regions where products show notable disagreement, targeted photo-interpretation was conducted to identify the specific sources of divergence.
The full analysis covers 8 Sentinel-2 tiles, carefully selected to represent Quebec's major bioclimatic domains, spanning from temperate and boreal forests to northern tundra environments.
Key Findings: COTQ Most Closely Resembles ESA WorldCover
The study compares COTQ against three global 10-meter products: ESA WorldCover, ESRI LandCover, and Google DynamicWorld. Results show that among the three reference products, COTQ's structural and spectral characteristics are most similar to ESA WorldCover.
However, the study also reveals systematic differences, primarily attributable to divergent class definitions and thematic priorities. The most pronounced discrepancies are concentrated in:
- Urban areas: Differing criteria for delineating urban boundaries and built-up zones;
- Wetlands: Inconsistent delimitation of wetland extents across products;
- Rocky or cryptogamic surfaces: Significant classification differences for these specialized surface types, which are particularly critical in northern Quebec environments.
These differences are not simply a matter of accuracy — they reflect fundamentally different design philosophies and classification logic across products.
Although ESA WorldCover, ESRI LandCover, and Google Dynamic World all use Sentinel-2 imagery at 10-meter resolution, they differ fundamentally in their mapping approaches. ESA WorldCover employs a hybrid rule-based and machine learning batch processing pipeline, releasing a static annual layer following the FAO Land Cover Classification System (LCCS) with 11 primary classes. ESRI LandCover also produces static annual outputs but relies on large-scale crowdsourced training samples and deep learning models. Google Dynamic World takes an entirely different technical approach: it outputs per-pixel class probabilities in near-real-time rather than a single hard classification label, allowing users to aggregate temporal data according to their own needs. This design difference means Dynamic World is inherently more flexible, but direct comparison with static products requires an additional temporal aggregation step that can introduce further uncertainty.
Significance: Objective Positioning for Operational Monitoring
The value of this multi-criteria evaluation lies in providing an objective characterization of COTQ and clearly establishing its position relative to existing global land cover datasets. For Quebec's operational land monitoring workflows, this positioning analysis has practical implications — users can better understand which classes COTQ handles more reliably and where interpretation should be approached with caution.
For the broader remote sensing community, this study also offers a replicable evaluation paradigm: when regional and global products coexist, rather than simply comparing overall accuracy, a more informative approach combines structural, spectral, and visual interpretation methods to understand the behavioral characteristics and applicable boundaries of each product. This framework is valuable to any organization that needs to choose between local and global products for a specific application context.
Related articles
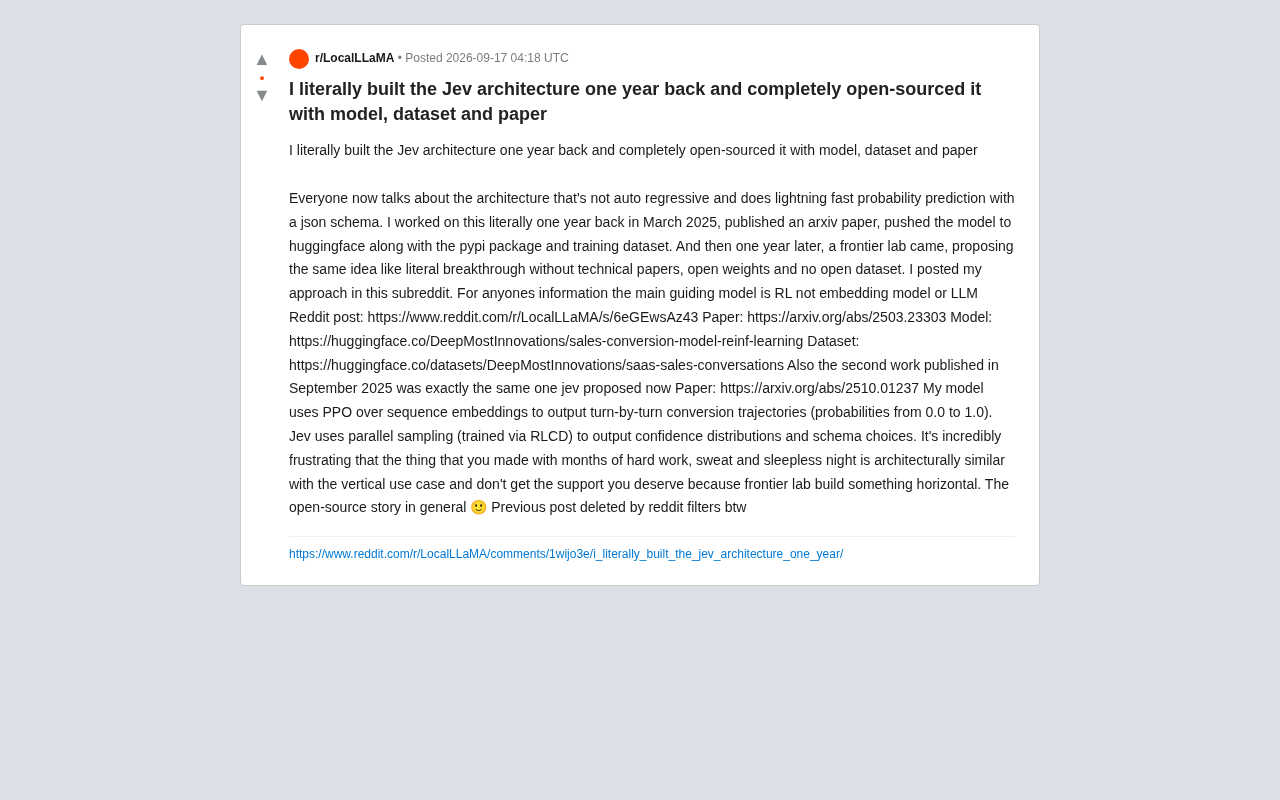
The Open Source Dilemma: A Non-Autoregressive Architecture Pioneer Overshadowed by Frontier Labs
An indie developer claims a frontier lab repackaged his year-old open-source non-autoregressive RL architecture as a breakthrough. We compare PPO sequence embeddings vs. RLCD parallel sampling and examine open source attribution gaps.
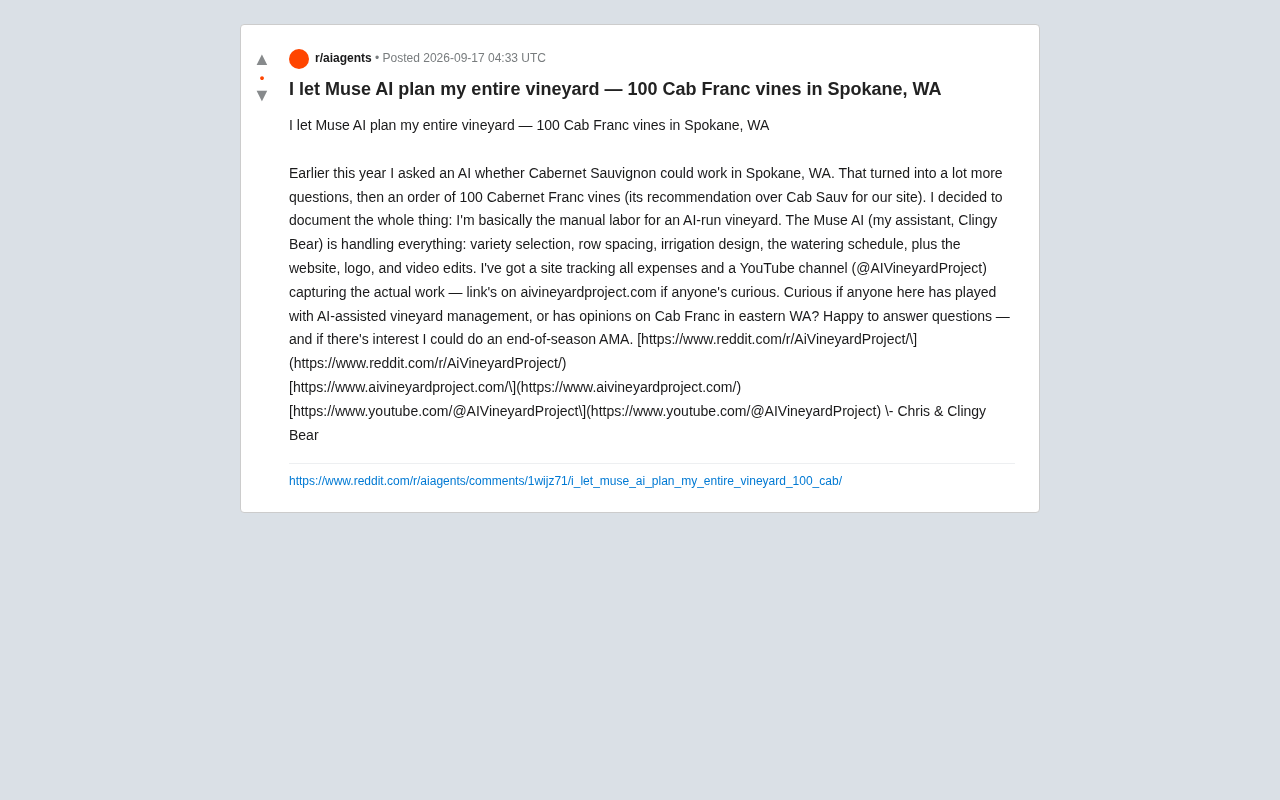
AI Plans an Entire Vineyard: A Real-World Experiment with 100 Grapevines
A Spokane hobbyist let Muse AI plan his entire vineyard — variety, spacing, irrigation, even the logo. He planted 100 Cabernet Franc vines and is documenting everything publicly.
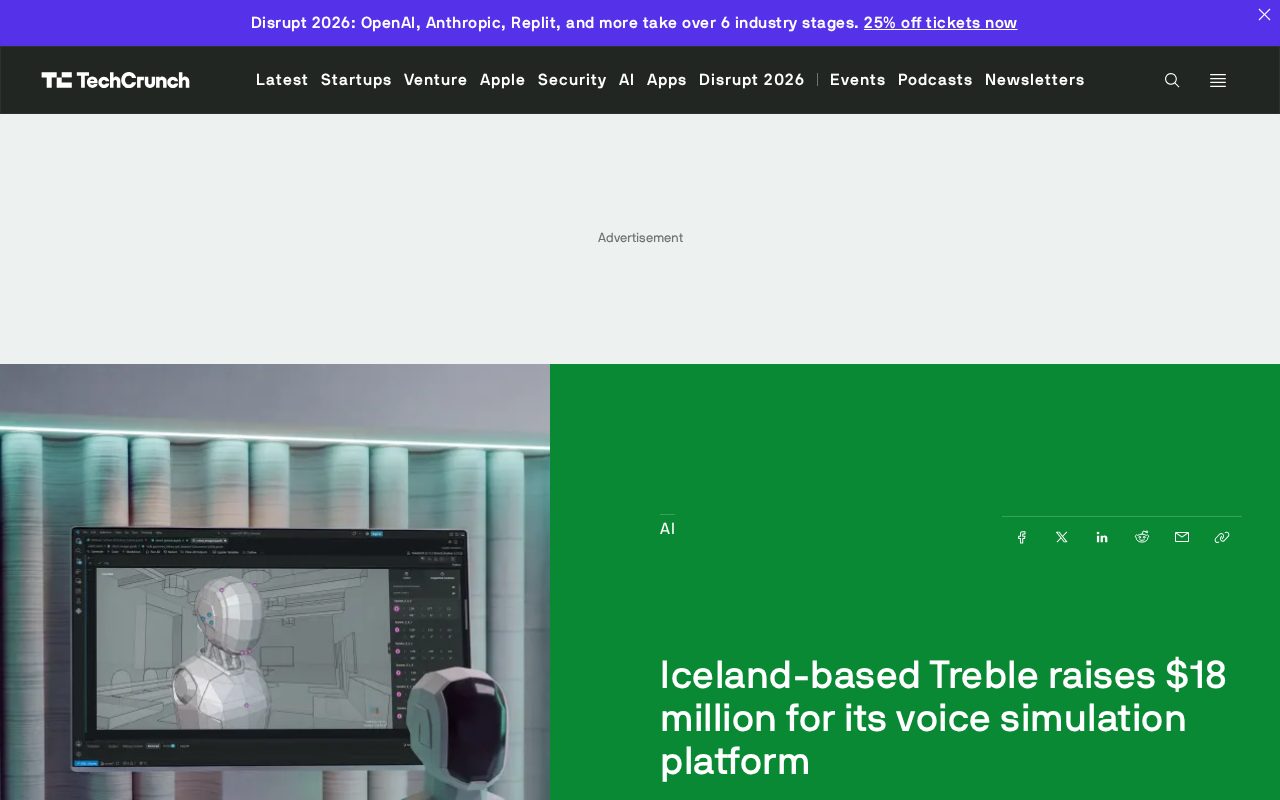
Iceland's Treble Raises $18M to Bet on Voice Simulation Platform
Iceland-based voice simulation company Treble raises $18M. Its platform serves voice AI developers, AI wearables, and robotics firms. A deep dive into the technology and what the funding signals.