GPU Utilization at 100% Doesn't Mean Full Load: How to Truly Diagnose Training Bottlenecks

Why nvidia-smi's 100% GPU utilization is misleading and how to use MFU and profiling tools to find real bottlenecks.
nvidia-smi reports 100% GPU utilization whenever any kernel is running, regardless of actual compute resource usage. This article explains why this metric is deceptive, introduces professional diagnostic tools like DCGM and PyTorch Profiler for identifying real bottlenecks, and advocates MFU (Model FLOPs Utilization) as the gold standard for measuring true training efficiency.
A Misunderstood Number: nvidia-smi's 100%
In large-scale model training, almost every engineer's first instinct is to open nvidia-smi and check GPU utilization. When the number shows 100%, many breathe a sigh of relief—the GPU is maxed out, everything is fine. But the reality is far from it.
nvidia-smi (NVIDIA System Management Interface) is a command-line tool distributed alongside NVIDIA's drivers, originally designed to provide system administrators with basic GPU status information, including temperature, power consumption, memory usage, and so-called "GPU utilization." It generates reports by reading internal GPU performance counters, with a typical sampling period of 1 second. Due to its out-of-the-box convenience, it has become the first GPU monitoring tool most developers encounter. However, its original purpose is closer to a "health check" than "performance analysis"—and this difference in positioning is precisely where the misunderstanding originates.
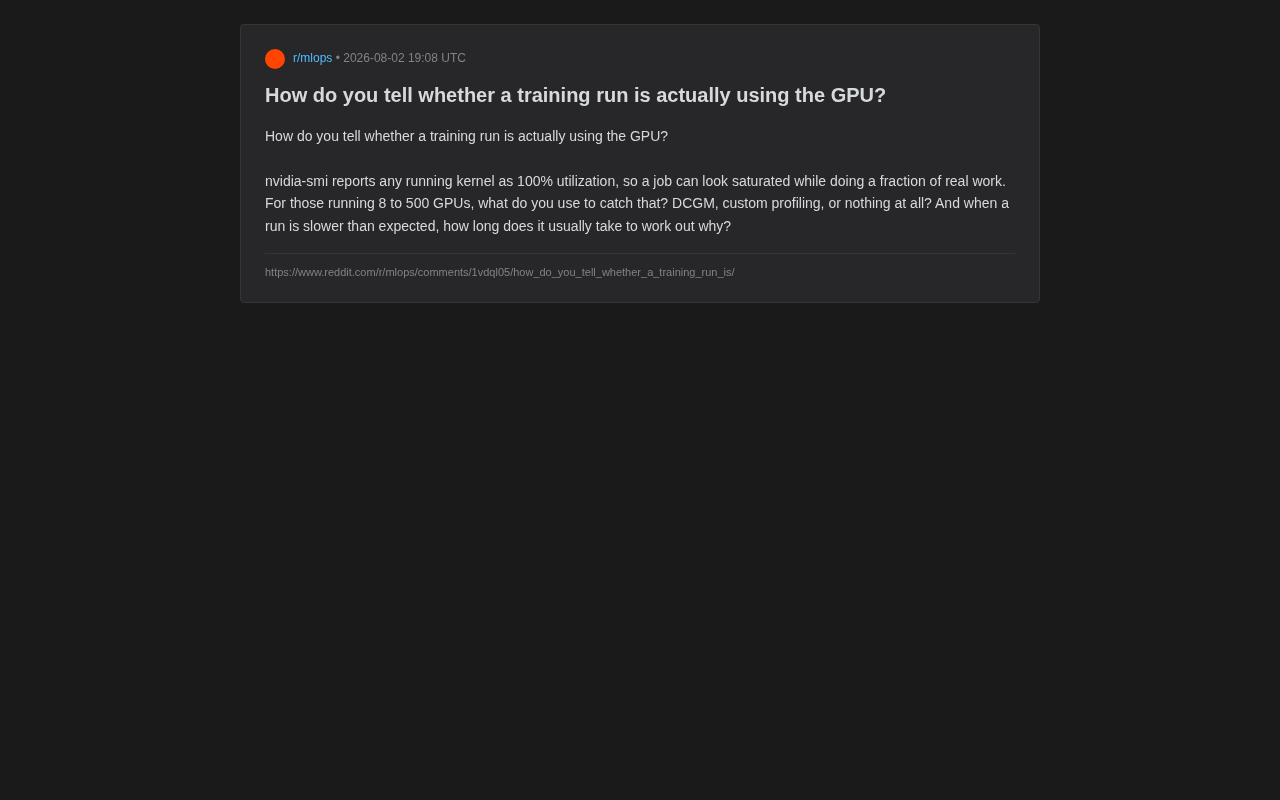
Recently, an engineer on Reddit who operates clusters ranging from 8 to 500 GPUs raised a pointed question: How do you tell whether a training run is actually using the GPU effectively? He highlighted a widely overlooked truth: the "utilization" reported by nvidia-smi essentially only measures "whether a kernel is currently executing." As long as any compute kernel is running on the GPU—even if it only occupies a tiny fraction of the compute units—this metric will still show 100%.
This means a training task can appear to be "running at full capacity" while actually doing only a small fraction of the work it should be doing. This phenomenon of "false saturation" is the root cause of many training jobs running slowly without an obvious explanation.
Why 100% GPU Utilization Is Deceptive
To understand this problem, we first need to clarify what nvidia-smi's "GPU-Util" actually measures. This metric records the percentage of time within the sampling window during which at least one kernel is executing on the GPU—not the actual utilization of compute resources.
GPU Compute Architecture: Understanding "Partial Utilization"
Modern NVIDIA GPU compute architectures consist of multiple Streaming Multiprocessors (SMs), each containing dozens to hundreds of CUDA cores, Tensor Cores, register files, shared memory, and L1 cache. Take the A100 as an example: it has 108 SMs, each containing 64 FP32 CUDA cores and 4 third-generation Tensor Cores. When a CUDA kernel is launched, it gets decomposed into multiple thread blocks distributed across SMs for execution. If the kernel's parallelism isn't high enough, only a few SMs may be activated while the rest remain idle—yet nvidia-smi will still consider the "GPU as working."
Typical Scenarios: High Utilization but Wasted Compute
Suppose your training loop has a severe data loading bottleneck, or tensor operation shapes aren't aligned to hardware-friendly dimensions. The GPU might be repeatedly launching small kernels, each using only a fraction of the available CUDA cores. But since kernels are indeed "running," nvidia-smi will still show 100%.
Problems that high utilization can mask include:
- Low kernel occupancy: A single kernel only engages a portion of the GPU's Streaming Multiprocessors (SMs). In NVIDIA's GPU architecture, threads are grouped into warps of 32—the fundamental unit of GPU scheduling and execution. SMs hide memory access latency by rapidly switching between multiple active warps. Occupancy is defined as the ratio of actually active warps on an SM to the theoretical maximum number of warps. Low occupancy means the SM doesn't have enough warps to hide latency, causing compute units to frequently stall. Factors affecting occupancy include the number of registers used per thread, shared memory usage, and thread block size configuration.
- Memory bandwidth bottleneck (memory-bound): Compute units are waiting for data transfers rather than performing floating-point operations. The A100's HBM2e bandwidth is 2TB/s, but when arithmetic intensity (floating-point operations per byte of data) is too low, compute units will still idle because they're "starved."
- CPU-GPU data pipeline stalls: Data loading and preprocessing can't keep up with GPU consumption speed. A typical training data pipeline involves disk reads, decoding, data augmentation, and transfer to GPU memory—any stage becoming a bottleneck will starve the GPU.
- Excessive communication overhead: In multi-GPU training, collective communications like AllReduce consume significant time. In distributed data parallel training, each GPU independently computes gradients, then aggregates and averages all GPUs' gradients through an AllReduce operation. AllReduce is typically implemented using Ring-AllReduce or Tree-AllReduce algorithms, transferring data via NVLink (high-speed GPU interconnect with up to 600GB/s bandwidth) or PCIe/InfiniBand networks. If communication isn't pipelined to overlap with computation, GPUs may be computationally idle while waiting for gradient synchronization to complete. NCCL (NVIDIA Collective Communications Library) is the standard library for implementing these communication primitives, and tuning it directly impacts multi-GPU scaling efficiency.
None of these problems will show up in nvidia-smi's utilization numbers, yet they tangibly slow down training.
Professional GPU Performance Diagnostic Toolchain
What do teams running large-scale clusters actually rely on to catch these hidden issues? The mature approach typically combines multiple tools in a layered fashion.
DCGM: The Foundation of Cluster-Level GPU Monitoring
For teams running tens to hundreds of GPUs, NVIDIA's DCGM (Data Center GPU Manager) is practically standard. Compared to nvidia-smi's coarse utilization metric, DCGM collects much finer-grained metrics:
- SM Activity: The actual utilization ratio of Streaming Multiprocessors
- Tensor Core Utilization: Whether mixed-precision training is actually leveraging Tensor Cores. Tensor Cores are specialized matrix operation units introduced by NVIDIA starting with the Volta architecture, specifically accelerating matrix multiply-accumulate (GEMM) operations. In deep learning training, Mixed Precision Training executes matrix operations in forward and backward passes using FP16 or BF16, while gradient accumulation and parameter updates remain in FP32 precision. This approach can boost training throughput by 2-3x while reducing memory usage. However, Tensor Cores can only be efficiently utilized when tensor dimensions are aligned to specific multiples (typically multiples of 8 or 16). If dimensions aren't aligned, operations may fall back to regular CUDA cores, resulting in extremely low Tensor Core utilization.
- Memory Bandwidth Utilization (DRAM Activity): Determining whether the task is memory-bottlenecked
- FP16/FP32 Compute Pipeline Occupancy
- PCIe/NVLink Communication Traffic
The most critical among these are profiling metrics like DCGM_FI_PROF_PIPE_TENSOR_ACTIVE, which tells you how busy the Tensor Cores actually are. If your model claims to be running BF16 training but this number stays consistently below 30%, you can essentially conclude that compute power is being severely wasted.
DCGM is typically used in conjunction with Prometheus and Grafana to build real-time visual monitoring dashboards. NVIDIA provides an official dcgm-exporter container that directly exposes DCGM metrics to Prometheus for scraping, enabling cluster operations teams to observe the true running state of hundreds of GPUs simultaneously on a unified dashboard.
Kernel-Level Profiling: Pinpointing Specific Code Bottlenecks
Once DCGM identifies anomalies, the next step requires more granular profiling tools to locate specific operations:
- PyTorch Profiler: Integrated directly into the training framework, it reveals the duration of each operator, GPU/CPU time distribution, and whether data loading has become a bottleneck. It's built on CUPTI (CUDA Profiling Tools Interface) and the Kineto library, producing trace files that can be visualized in Chrome's trace viewer or TensorBoard.
- NVIDIA Nsight Systems / Nsight Compute: System-level and kernel-level deep profiling that reveals kernel occupancy, warp execution efficiency, and memory access patterns. Nsight Systems provides a timeline view showing the temporal relationship between CPU and GPU activities, helping discover synchronization points and bubbles; Nsight Compute dives into individual kernels, analyzing performance gaps relative to theoretical limits.
- Flame Graphs: Intuitively show where time is being spent by stacking call stacks, letting engineers spot hotspot functions at a glance.
These tools answer the question of "why is it slow"—is the data pipeline starving the GPU? Is a custom operator implemented inefficiently? Or is communication failing to overlap with computation?
How Long Does Training Bottleneck Diagnosis Take?
The original Reddit post also raised a practical question: When training is slower than expected, how long does it typically take to figure out why?
Diagnosis time heavily depends on the maturity of a team's monitoring infrastructure:
- Teams without dedicated monitoring: May require hours or even days, often relying on trial-and-error and educated guessing
- Teams with DCGM-level metric monitoring deployed: Can quickly narrow the scope to broad categories like "compute bottleneck / memory bottleneck / communication bottleneck," typically within tens of minutes to a few hours
- Teams with complete observability systems: Combining automated alerts and historical baseline comparisons, they can even proactively identify issues as anomalies occur
The core efficiency difference comes from whether a performance baseline has been established in advance. If you clearly know what MFU a given model should achieve in a healthy state, then the moment actual values deviate, you can immediately recognize a problem exists—rather than being deceived by the illusion of 100%. A common approach to establishing baselines is running a few epochs with a small-scale dataset during the initial deployment of a training task, recording steady-state throughput, per-layer operator time distribution, and communication time ratio as references for ongoing monitoring.
The True Measure of Training Efficiency: MFU
Rather than fixating on nvidia-smi's utilization numbers, the industry increasingly advocates MFU (Model FLOPs Utilization) as the gold standard for training efficiency.
MFU is calculated by dividing the actual floating-point throughput achieved during training by the hardware's theoretical peak compute capacity. For example, if an A100 with a theoretical peak of 312 TFLOPS (BF16) only achieves 120 TFLOPS in your training, the MFU is approximately 38%.
For Transformer models, the theoretical FLOPs per training step can be approximately estimated as 6 × parameter count × sequence length × tokens per batch (the coefficient of 6 comes from the empirical formula of ~2x parameter count for forward pass operations plus ~4x parameter count for backward pass operations). Dividing this by the actual elapsed time and then by hardware peak compute yields MFU. Google reported approximately 46.2% MFU in the PaLM paper (on 6144 TPU v4 chips), and Meta's LLaMA training achieved approximately 43% MFU on 2048 A100s. These numbers are considered industry benchmarks for large-scale training.
The reasons MFU cannot reach 100% are multifaceted: activation functions, LayerNorm, and other non-matrix operations cannot leverage Tensor Core peak throughput; multi-GPU communication overhead is unavoidable; pipeline parallelism bubbles waste time slices; memory bandwidth becomes a bottleneck in certain operations; and there are also system-level overheads like kernel launch costs and synchronization waits.
The value of this metric lies in the fact that it directly reflects how much of the money you're paying for compute is actually converting into training progress. Well-optimized large model training in the industry typically maintains MFU between 40%-55%, while poorly optimized tasks may only achieve 10%-20%. This gap translates to multiplicative differences in training cost and time—optimizing MFU from 20% to 40% for the same training task is equivalent to cutting training time and electricity costs in half.
Conclusion: Building a Correct GPU Training Efficiency Evaluation Framework
This discussion reveals a widespread misconception in deep learning engineering practice: 100% GPU utilization is only a necessary condition, far from a sufficient one.
For any team serious about training costs and efficiency, the correct approach is:
- Abandon the blind trust in
nvidia-smiutilization numbers - Deploy DCGM and similar tools to monitor SM activity and Tensor Core utilization
- Use PyTorch Profiler or Nsight to pinpoint specific bottlenecks
- Adopt MFU as the ultimate efficiency benchmark
- Establish healthy baselines in advance to enable rapid anomaly detection
In an era where individual GPUs cost tens of thousands of dollars and cluster sizes continue to expand, the ability to see through the truth behind "100%" directly determines training economics and iteration speed. At current H100 cloud rental prices, a 256-GPU cluster can cost tens of thousands of dollars per day. If you're blinded by false 100% utilization and fail to detect a 30% efficiency loss, it means thousands of dollars wasted every day. This is not just a technical problem—it's a cost problem.
Related articles

Gaussian Process Bandit Optimization: Exploration Strategies and Inference Regret Guarantees
Cumulative regret guarantees in Bayesian optimization fail to reflect final recommendation quality. This article examines a new study that provides inference regret guarantees for Gaussian process bandit optimization through exploration query strategies and fill distance analysis, validated on hyperparameter optimization and control tasks.
The Most Detailed Codex Guide on Bilibili: From Installation to Real-World Practice
The most detailed Codex guide on Bilibili: from app store installation to daily work mode configuration, with a real coffee shop project demonstrating file organization, data extraction, dashboard creation, and other practical tasks. Learn to use Plan Mode and desktop pets to leverage Codex efficiently.

Appearance Compensation in Volume Rendering: Why RGB Accuracy Cannot Guarantee Density Correctness
Volume rendering research reveals that volumetric data perfectly reproducing external RGB views may still contain density errors: appearance compensation can double central density and keep external rays unchanged even when L2 error exceeds 14.52%. Density recovery depends on appearance capacity, spatial resolution, and measurement design.