Interactive Science Masterpiece: Bartosz Ciechanowski Illustrates the Nature of Sound
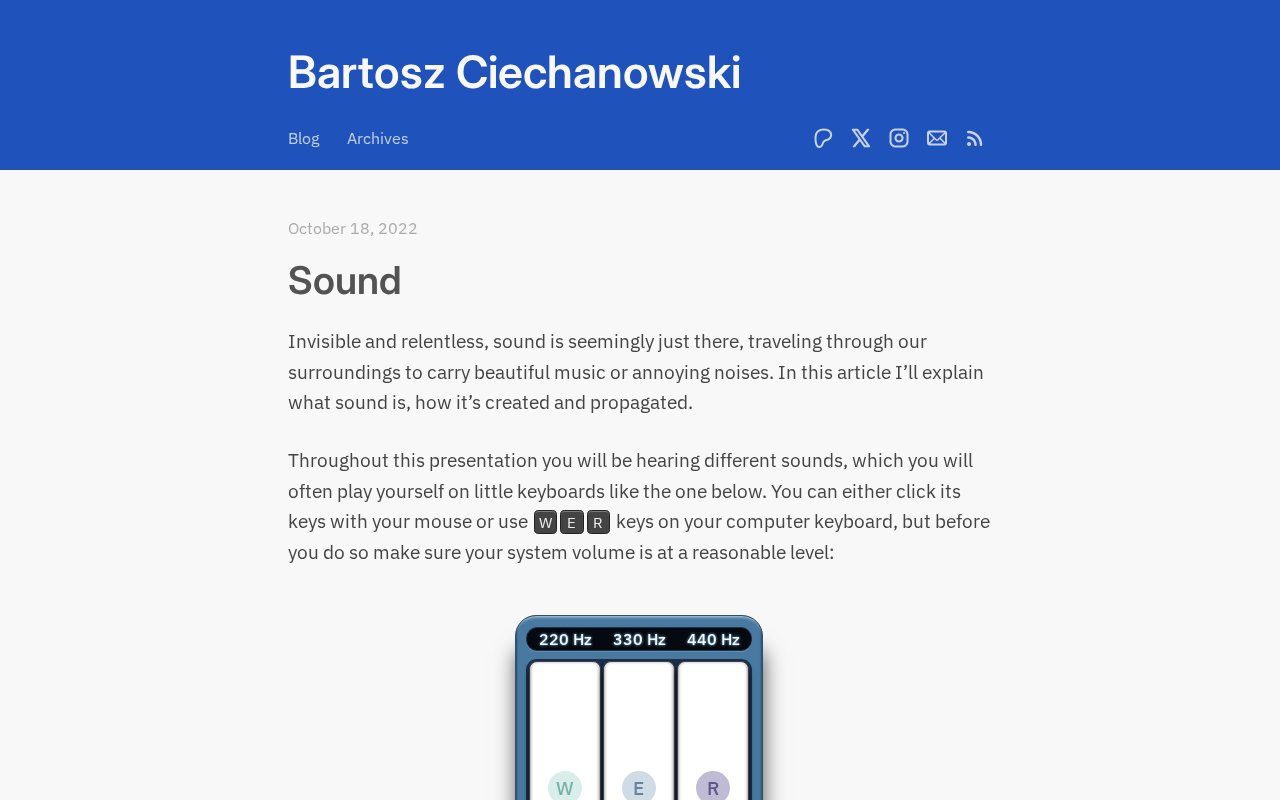
Ciechanowski's interactive essay Sound makes the physics of sound tangible through hands-on simulators, setting a new bar for science communication.
Bartosz Ciechanowski's new work Sound continues his interactive science communication approach, sparking broad discussion on Hacker News. Starting from pressure waves created by disturbed air molecules, it introduces frequency, wavelength, pitch, harmonics, and timbre, each step paired with a real-time adjustable simulator so readers generate conclusions themselves. Its core value lies in turning parameter space into an explorable experimental ground where instant feedback builds physical intuition.
In the tech community, the name Bartosz Ciechanowski is often synonymous with "explaining complex physics clearly." His latest interactive article, Sound, once again proves that a long-form web article with no video and no flashy effects can still let people immersively understand the underlying logic of sound.
Why This Science Piece Went Viral
In the Hacker News discussion, readers reached a clear consensus — Ciechanowski's diagrams aren't "illustrations," they're cognitive scaffolding. He habitually uses draggable, adjustable interactive controls to translate abstract formulas into feedback your fingers can feel.
Sound continues this methodology. The article starts from "how air molecules get pushed" and gradually builds up to waveforms, frequency, harmonics, and perception. Every step comes with a simulator you can tweak in real time — readers aren't looking at conclusions, they're manufacturing them by hand.
The Cognitive Ladder of Deconstructing Sound
From Particles to Pressure Waves
The essence of sound is a pressure disturbance in a medium. Instead of throwing out the wave equation directly, Ciechanowski first has readers observe the chain reaction of a column of air molecules after being disturbed. When the disturbance source moves periodically, compression zones and rarefaction zones alternately propagate outward — that's a sound wave.
This rhythm of "see the phenomenon first, then introduce the concept" is the biggest divide between him and textbook-style science communication.
The wave equation is a mathematical tool describing how waves propagate through a medium, usually written as a second-order partial differential equation, for example in one dimension ∂²u/∂t² = c²·∂²u/∂x², where u represents medium displacement or pressure disturbance and c is the wave speed. It captures the proportional relationship between a wave's acceleration and spatial curvature — once initial and boundary conditions are given, the waveform at any moment can be predicted. Ciechanowski deliberately doesn't throw this equation out at the beginning, because although it's precise, it requires readers to first have an intuition for calculus and partial derivatives. He chooses to start from the collision sequence of discrete particles, letting readers first build a mental picture of "compression—rarefaction—compression" propagation, then work backward to understand that the term on the right side of the equation is really describing this spatial curvature. This cognitive path from discrete simulation to continuous equations effectively prevents formulas from degenerating into symbol manipulation.
Frequency, Wavelength, and Pitch
After establishing the basic picture of waves, the article introduces the concept of frequency. Interactive controls let readers change the vibration speed and directly see the wavelength stretch and shrink in response. Ciechanowski uses this to explain the correspondence between pitch and frequency, and naturally transitions to the boundary question of the human audible range.
Harmonics and Timbre
If the article stopped at sine waves, it would just be a competent physics primer. What truly keeps readers hooked is the harmonics section: he shows how a complex waveform can be decomposed into multiple sinusoidal components, and explains why the same fundamental frequency sounds completely different on different instruments — timbre hides in the relative strength of harmonics.
Fourier analysis is the mathematical cornerstone for understanding harmonic decomposition. Its core idea is that any periodic signal satisfying certain conditions can be represented as the sum of a series of sine waves with different frequencies, amplitudes, and phases. In the context of sound, the fundamental frequency determines pitch, while the relative strength of each harmonic (sinusoidal components whose frequencies are integer multiples of the fundamental) determines timbre. The waveform decomposition Ciechanowski demonstrates is essentially a visualization of the Fourier series. When readers drag controls to change individual harmonic components, they're actually reshaping the spectral envelope in the frequency domain, and the time-domain waveform changes visibly in response. This is also why a violin and a flute at the same pitch sound completely different: they share the same fundamental frequency, but their harmonic energy distributions differ significantly. Understanding this gives you the key bridge from "perceived sound" back to "physical quantities."
The human audible range is usually defined as 20 Hz to 20 kHz, but this boundary depends heavily on individual age and hearing health. As people age, high-frequency perception declines first — after middle age, frequencies above 15 kHz are often imperceptible. Moreover, the "pitch" of a sound doesn't strictly correspond to a single frequency: for complex tones, what the ear perceives is the fundamental, and even when the fundamental's energy is weak or missing, the brain can reconstruct the perception of the missing fundamental from the spacing of the harmonics — a phenomenon known as the "missing fundamental effect." By introducing the audible range in the frequency and pitch section, Ciechanowski is actually laying groundwork for the later harmonic discussion — because whether a harmonic can be perceived is directly constrained by this frequency window. Understanding these boundary conditions helps readers avoid oversimplifying the "frequency–pitch" relationship.
The Methodological Value of Interactive Diagrams
What makes Ciechanowski's work valuable isn't visual flair — it's that he turns the "parameter space" into a playground you can wander through. Readers can immediately see how the whole system reorganizes when a variable changes. This instant feedback loop is far closer to how physical intuition forms than static charts.
For anyone doing tech communication, documentation writing, or even product design, this is a directly borrowable paradigm: the key to lowering the barrier to understanding isn't simplifying conclusions, it's making the reasoning process operational.
Who Should Spend Time Reading This Long Article
- People who want to re-understand the physics of sound but are intimidated by formulas
- Creators in technical writing or science communication who need reference for interactive storytelling techniques
- Front-end developers interested in implementing interactive web visualizations
The article doesn't pile up references or resort to emotional rhetoric. Its persuasiveness comes from every simulator you can personally verify. If you're looking for a model of "explaining difficult things in a way that isn't difficult," this Sound is worth walking through in full.
One-line Summary
Bartosz Ciechanowski's interactive long-form article Sound uses hands-on simulators to make the physics of sound perceptible, offering a new paradigm for technical science communication.
Paragraph Summary
Bartosz Ciechanowski's new work Sound continues his interactive science communication methodology and has sparked widespread discussion on Hacker News. The article starts from pressure waves formed by disturbed air molecules and gradually introduces concepts like frequency, wavelength, pitch, harmonics, and timbre. Each step comes with a real-time adjustable simulator, letting readers manufacture conclusions by hand rather than passively accept them. Its core value lies in turning the parameter space into an explorable experimental ground, using instant feedback loops to help readers build physical intuition. The article doesn't pile up formulas or references, but instead uses the rhythm of "see the phenomenon first, then introduce the concept" to lower the barrier to understanding. For anyone wanting to re-understand the physics of sound, work in technical writing, or do front-end visualization, this is a directly borrowable sample of interactive storytelling.
Related articles

WorkBuddy Full Tutorial: Build an AI Office Automation Agent from Scratch
A complete WorkBuddy tutorial: installation, three working modes, multimodal picture book video practice, expert team agent building, and workflow configuration for low-cost AI office automation.

WorkBuddy Agent Complete Guide: From Beginner to Automation in 7 Days
Based on Bilibili's 256-episode WorkBuddy masterclass, this systematically breaks down Tencent's AI office workbench core capabilities: Agent principles, Skill encapsulation, cross-platform connectors, scheduled automation, knowledge bases, and zero-code development, with learning path recommendations.

8 AI Accounts, 7 Failed: An Honest Review of Using AI to Get Work Done
Only 1 of 8 AI-run Bilibili accounts succeeded. We break down the real difference between "performing AI" and "using AI to get work done."