MemoryPet 2.0: Turn Your Browser Toolbar Into an Animated Resource Monitor
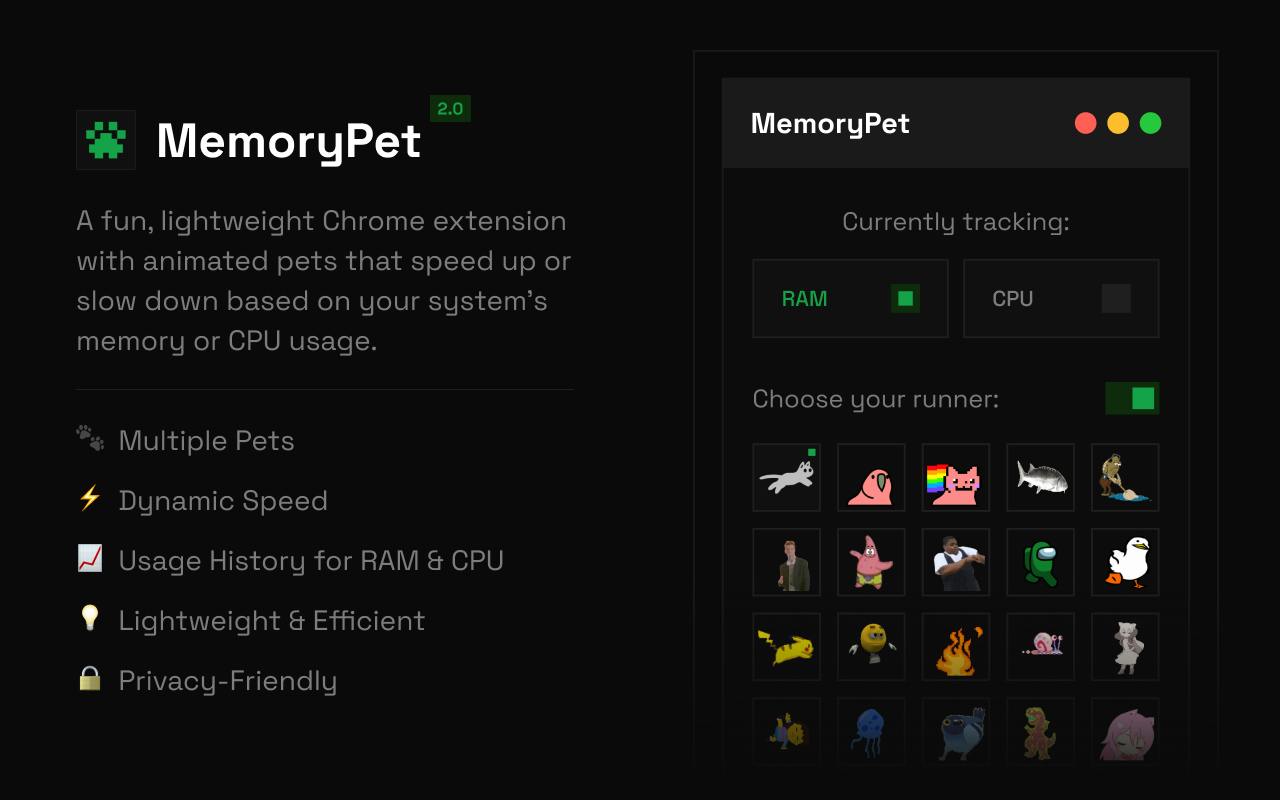
MemoryPet 2.0 turns Chrome toolbar into a fun, animated system resource monitor with CPU tracking.
MemoryPet is a Chrome extension that transforms dry performance data into intuitive visual feedback via an animated toolbar pet whose speed reflects system load. Version 2.0 adds CPU tracking alongside memory monitoring, 8 new pets, a hoverable historical usage graph, and a minimal mode that swaps animations for a live percentage badge. Positioned as a small but beautifully crafted tool, it lowers the psychological barrier to performance monitoring while remaining flexible enough for both playful and no-nonsense users.
A Tiny Pet Living in Your Toolbar
Performance monitoring has always been the domain of power users — Task Manager, Activity Monitor, various command-line tools, walls of numbers that make most people's eyes glaze over. MemoryPet takes the complete opposite approach: it places a tiny animated pet in your Chrome toolbar, and this little creature speeds up or slows down based on your system's memory or CPU usage. The busier your machine, the more frantically it runs; when the system idles, it lounges around lazily.
This design transforms abstract performance data into an intuitive, "get it at a glance" experience. You don't need to stare at percentages and do mental math — just a quick peek at the toolbar gives you a rough sense of your machine's current load. Developer Veit Voss describes it as "glanceable, oddly satisfying" — easy to scan for information while carrying a strange, almost therapeutic charm. The product currently sits at 75 upvotes and ranks #17 on Product Hunt.
What's New in Version 2.0
Compared to the original release that only monitored memory, MemoryPet 2.0 delivers a substantial feature expansion, with core upgrades in four areas:
CPU Tracking Joins the Monitoring Suite
The most significant change is the addition of CPU usage tracking, now running alongside the existing memory monitor. This means the pet's animation speed can now reflect system pressure across two dimensions, making this little "toolbar barometer" far more comprehensive. For users who habitually keep dozens of tabs open or run heavy web apps, being able to sense both memory and CPU state simultaneously is a genuinely useful addition.
From a technical standpoint, browser extensions access CPU and memory data through Chrome's chrome.system.cpu and chrome.system.memory APIs. These interfaces belong to Chrome's system information permissions group — extensions must declare the corresponding permissions in their manifest to use them. Worth noting: the CPU usage a browser extension can read reflects the entire operating system, not just the Chrome process itself. This means MemoryPet reflects the load of your entire machine, including other apps running in the background — which is precisely why it works as a general-purpose system status barometer rather than just an indicator of the browser's own resource consumption.
8 New Pets and an Interactive Usage Graph
Version 2.0 adds 8 new pets in one go, offering far more personalization options. It also introduces a hover-able usage graph — mousing over the toolbar icon reveals a detailed historical usage curve, rather than just the current animation state. This elevates the extension from a purely "aesthetic" plugin to something with real data-querying utility.
Technically, a hover-able usage graph is typically implemented through the extension's popup page — the small window that appears when you click or hover over the toolbar icon. The extension periodically samples CPU and memory data in the background, stores the time-series data in memory or chrome.storage, then renders it as a line chart in the popup using Canvas or SVG. This design pattern is common in system monitoring extensions: it avoids consuming the main page's DOM resources while offering richer trend information than a single real-time value. Users can see load fluctuations over the past few minutes rather than just a single instantaneous snapshot.
An Animation-Free Minimal Mode
Recognizing that not everyone wants something wiggling around in their toolbar, version 2.0 includes an option to fully disable animations. With animations off, the toolbar displays a live percentage badge instead — returning to the cleanest, most direct form of information presentation. This design accommodates two completely different types of users: those who enjoy the playful experience, and those who just want clean numbers.
The Product Philosophy Behind Playful Design
MemoryPet belongs to the category of "small but beautifully crafted" browser extensions — it doesn't solve any grand problem, but takes a function that's ordinarily tedious and makes it something people actually want to use. Products like this derive their value from lowering the psychological barrier to accessing information: by "personifying" cold performance data, users are actually more likely to develop the habit of casually checking their system state.
In terms of product categorization, it spans browser extensions, Chrome extensions, productivity tools, and user experience — a fitting reflection of its positioning as both a tool and an experience. It doesn't chase the precision and depth of professional monitoring software; instead, it keeps users in a state of "vague awareness" about their machine's health at the lowest possible interruption cost.
The detail worth noting is the option to disable animations. Many playful products fall into the trap of being fun for fun's sake, eventually becoming distractions. MemoryPet's decision to preserve an exit back to minimal mode shows that the developer understands a key principle: playfulness is a bonus, but it can never come at the cost of the tool's core usability.
Who Is It For?
If you're the type who often wonders "is my computer struggling right now?" but doesn't want to install a suite of professional monitoring software, MemoryPet is a lightweight and charming option. It won't give you diagnostic reports accurate to decimal places, but it's more than enough to give you an intuitive sense of system load, right from your browser toolbar.
For heavy multi-tab users, developers, or people who simply enjoy desktop gadgets, version 2.0's new CPU tracking and usage graph bring its practical value up a notch. And for those who dislike anything flashy, a single click switches it back to pure numbers mode. This "can be rich or minimal" flexibility is exactly why it carves out its own space in a crowded browser extension market.
Related articles

The Hidden Risks of Culvert Failure: An Overlooked Infrastructure Hazard
Culverts are hidden drainage structures buried beneath roads. Their failure can silently hollow out road beds, cause localized flooding, and trigger deadly collapses — yet they remain chronically overlooked.

Naoma AI Demo Agent V2: Turning Website Traffic into Booked Meetings with AI Sales
Naoma AI Demo Agent V2 replaces demo request forms with an AI sales rep that demos products, qualifies leads, and books meetings in real time. 50K+ demos run.
Slashy Assistant: The AI Email Assistant That Handles Your Inbox for You
Slashy Assistant is an AI-native email client with a built-in smart assistant that drafts replies in your voice, organizes email, schedules meetings, and tracks follow-ups. Accessible via iMessage, Slack, and phone — set up in five minutes.