OpenTelemetry LLM Tracing: What to Collect and What to Drop

LLM tracing should collect high-value signals like model differences, tokens, and TTFT, and drop noise like chunks and full payloads.
LLM applications generate massive tracing data in production, and traditional APM based on HTTP status codes can't identify hallucinations, refusals, or Agent stalls. Based on OpenTelemetry GenAI semantic conventions, the article outlines high-value signals to collect (request/response model differences, standardized token counts, TTFT, Prompt template versions, tool call parameters, tenant cost attribution) with key attributes for client, retrieval, tool, and Agent Spans, and identifies four noise patterns to drop: per-chunk streaming Spans, full-payload collection, embedding vectors as attributes, and micro-Spans for framework internals. It recommends tail sampling to keep 100% of error and fallback Traces with only a 1%–2% baseline for normal requests, centralized PII redaction in the Collector, and presents a unified-telemetry AI gateway approach plus a workable Collector configuration example.
OpenTelemetry LLM Tracing: What to Collect and What to Drop
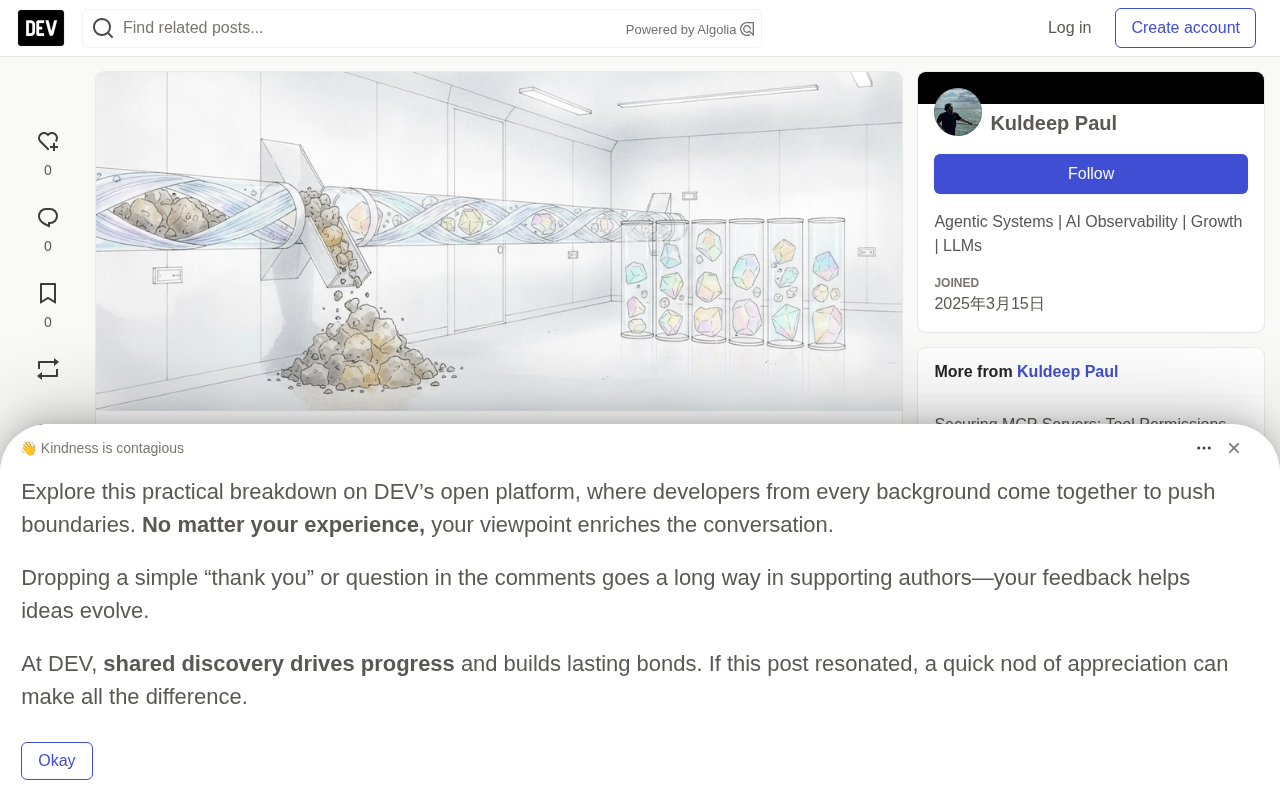
LLM applications continuously accumulate distributed tracing data in production, and cloud bills and observability pipelines are often the first to buckle—while engineers still can't explain why the Agent is stuck. OpenTelemetry provides a unified GenAI telemetry specification, but unfiltered instrumentation only creates noise, drowning out the genuinely useful failure signals. This piece revolves around one core question: in an LLM application, which fields deserve to go into a Span, and which should be dropped outright.
Why Traditional APM Can't Manage LLMs
Traditional APM judges system health by HTTP status codes, process memory, and endpoint latency distributions. In ordinary microservices, an HTTP 200 plus sub-second latency basically means everything is fine. LLM applications are not like this: a model can return HTTP 200 while the content is a serious hallucination, an unfounded calculation, a refusal, or an empty tool call.
Standard request metrics can't tell whether the application retrieved the right knowledge chunks, how many tokens multi-step reasoning burned, or whether an internal Agent fell into an infinite retry loop. So many teams turn to default auto-instrumentation packages—and hit the other extreme: telemetry flooding. A single user question in a modern AI orchestration framework can generate dozens of nested Spans, and once Agents or iterative RAG are involved, each step multiplies the Span count. An unfiltered pipeline writes massive amounts of duplicated text, internal serialization processes, and redundant middleware hooks straight into the storage backend—costs rise, but the root cause is never found.
What is a distributed tracing Span: A Span is the smallest unit of work in distributed tracing, representing an operation with a start time, end time, and metadata. Multiple Spans combine into a Trace through parent-child relationships or links, reconstructing the complete call path of a single request across services and components. Each Span typically carries a name, attributes (key-value pairs), status code, and events. In an LLM application, a single user question often corresponds to one Trace, with the model call, vector retrieval, and tool execution each being a child Span. Understanding Span granularity is the prerequisite for deciding "what to collect and what to drop": too coarse a granularity loses the detail needed for troubleshooting, while too fine a granularity produces large numbers of microsecond-level Spans that drown genuinely valuable failure signals in noise.
Core Span Types in the OTel GenAI Specification
OpenTelemetry GenAI semantic conventions are maintained by the CNCF and define standard attribute names for model parameters, token counts, and operation types under the gen_ai.* namespace. It models generative AI interactions as several discrete Span types:
- Client and gateway Spans (
gen_ai.client/gen_ai.gateway): record boundary calls to model providers, including the requested model, target server, token consumption, and response metadata. - Agent and orchestration Spans: model higher-level reasoning sequences, such as an Agent evaluating a user goal, selecting external tools, and reviewing results.
- Vector retrieval Spans: capture vector database queries, embedding model operations, similarity thresholds, and document chunk references.
- Tool and execution Spans: record external function calls, passed parameters, execution duration, and tool output.
It's worth noting that consistent attribute naming lets Traces produced by one service seamlessly connect with Spans emitted by downstream proxies or data layers—this is exactly the prerequisite for determining "who slowed down this request."
Why semantic conventions matter: Semantic Conventions are pre-defined attribute naming specifications that OpenTelemetry establishes for specific domains, defining field names, data types, and meanings. Without them, different teams would record the same concept as model_name, llm_model, model_id, and various other forms, causing cross-service queries and dashboard aggregations to fail. GenAI semantic conventions unify model parameters, token usage, and operation types under the gen_ai.* namespace, keeping fields consistent between Spans produced by one team using an OpenAI client and another using an Anthropic client. This is also the underlying reason the article emphasizes unifying telemetry through an AI gateway: naming consistency is the prerequisite for comparing latency, cost, and error rates across providers.
High-Value Signals: Fields That Must Be Collected
When troubleshooting, the on-call engineer doesn't start by reading thousands of text interactions—they look first for quantitative anomalies, structural breaks, and regression metrics. The signals truly worth collecting can be grouped into several categories.
Model identification and fallback. Record both gen_ai.request.model (the model the application requested) and gen_ai.response.model (the checkpoint that actually served it). If the gateway quietly routed traffic to a backup model due to rate limiting or failure, this difference precisely explains a sudden shift in response style.
Standardized token counts. Record input tokens, output tokens, and where available, reasoning or cache-read tokens. These numbers both support unit economics and expose token bloat from uncontrolled conversation history.
Time to first token (TTFT). For streaming responses, total duration only tells half the story: a request that returns its final token in ten seconds might have emitted its first token in 350 milliseconds (a good experience), or might have stalled for eight seconds before producing anything (a bad experience). These two cases point to completely different troubleshooting directions.
Prompt template version. Code deployments have git commits to check, but Prompt templates are often updated independently. Without a prompt.version attribute, determining whether a regression came from a code push or a Prompt rewrite requires manual comparison.
Tool calls and parameters. When an Agent calls an external function or MCP tool, recording the tool identifier, parameter structure, and HTTP return status is what distinguishes errors originating from model reasoning versus external API dependencies.
Tenant, virtual key, and cost attribution. Attaching tenant identifiers or gateway virtual keys enables per-customer margin calculation and department-level rate limiting.
| Span Type | Target Operation | Key Attributes | Diagnostic Value |
|---|---|---|---|
gen_ai.client | Direct model inference | Request/response model, input/output tokens, finish reason | Track provider latency, token usage, cost attribution, and model routing |
retrieval | Vector store/knowledge base | db.system, collection name, top_k, returned document count, minimum score | Reveal whether context retrieval failed or recalled irrelevant chunks |
tool.execute | MCP or Agent tools | Tool name, call ID, rpc.system, error.type | Distinguish external tool failures from model hallucinations |
agent.step | Iterative Agent loop | Iteration index, max iterations, goal ID, decision type | Detect infinite reasoning loops, repeated calls, and Agent stalls |
Pure Noise: Four Types of Instrumentation That Must Be Dropped
Telemetry noise refers to data that is high in volume and low in value—it consumes bandwidth, drives up database bills, slows down query interfaces, and introduces compliance risk. The following practices are especially prone to creating catastrophic noise in AI applications.
Anti-pattern 1: Creating a Span Per Chunk for Streaming Responses
When consuming SSE streaming endpoints, some auto-instrumentation or custom wrappers open a Span for each returned token chunk. A response generating 1,500 tokens would produce 1,500 Spans for a single HTTP interaction, blowing up local memory buffers and crashing the Collector entirely. The right approach is to use a single parent Span for the streaming operation, recording chunk timing internally, marking the first chunk (TTFT) with an event or attribute, and ending the Span when the stream closes.
Anti-pattern 2: Collecting Full Payloads Without Filtering
Storing the complete Prompt and completion text for every production request is the fastest way to turn an observability pipeline into a cost black hole. A high-throughput service processing tens of millions of tokens per day generates several gigabytes of unstructured strings. Worse, raw Prompts often carry PII, proprietary source code, or credential keys, directly running afoul of privacy regulations like GDPR and HIPAA. Full-content collection should be off by default in production, enabled only through dynamic sampling or in staging environments.
Anti-pattern 3: Stuffing Embedding Vectors into Span Attributes
Embedding models convert text chunks into 768-, 1536-, or even higher-dimensional float vectors. Storing 1,536 floats in a Span attribute yields nothing human-interpretable in the Trace panel—it only bloats the payload, adds serialization overhead, and exhausts downstream storage engine memory. Recording the dimension count, embedding model name, and text hash is enough; never serialize raw float arrays.
Anti-pattern 4: Creating Micro-Spans for Framework Internal Pipelines
Modern Agent libraries construct deep call stacks involving input validation, Schema parsing, JSON serialization, and internal hook triggering. Wrapping every dict transformation or regex check in a Span fills the Trace view with dozens of microsecond-level Spans. The engineer wanting to know why one LLM call took six seconds instead has to scroll past hundreds of irrelevant framework Spans. Instrumentation should focus on boundaries: network calls, database queries, external tool calls.
| Telemetry Element | Keep (High Value) | Drop (Low Value) | Reason for Trimming |
|---|---|---|---|
| Streaming output | Single Span + total tokens + TTFT event | Separate Span per token chunk | Prevent Collector memory exhaustion and Span explosion |
| Payload data | Template ID, template hash, token usage, finish reason | Full Prompt and completion for 100% of successful requests | Avoid PII leakage, reduce storage cost |
| Embedding vectors | Model name, token count, dimension, chunk ID | Raw multi-dimensional float arrays | Floats aren't searchable and amplify serialization overhead |
| Tool execution | Tool name, parameter keys, latency, error info | Intermediate framework serialization calls | Eliminate Trace clutter, focus on real I/O boundaries |
| Agent loop | Iteration count, decision state, tool selection intent | Every internal state machine transition and variable assignment | Avoid unreadably deep Trace trees under multi-turn execution |
Data-Plane Governance: Sampling, Redaction, and Cost
Keeping the OpenTelemetry pipeline efficient hinges on data-plane management. The Collector acts as a proxy between the application runtime and the storage backend, and is the right place to centralize filtering, sampling, and redaction.
Tail Sampling Keeps High-Impact Traces
Head sampling decides at request start (say, uniformly keeping 5%), which fails in LLM applications: key edge cases like timeouts, rate limiting, and extreme latency all fall in the long tail, and a uniform 5% would discard 95% of the rare failures you want to debug. Tail sampling decides whether to persist after the entire Trace lifecycle is complete, and can be configured to: keep 100% of Traces containing 4xx/5xx or Span errors, keep 100% of Traces showing p95/p99 latency spikes, keep 100% of Traces that triggered fallback routing, then retain 1%–2% of normal, fast HTTP 200 requests as a baseline comparison.
The trade-off between head sampling and tail sampling: Head sampling decides whether to keep a Trace the moment its first Span is created—simple to implement and low in resource overhead—but at decision time it can't see the request's final outcome, so extremely slow requests and error Traces are easily discarded at a fixed ratio, and these are exactly the objects most in need of debugging in LLM applications. Tail sampling must buffer the entire Trace in memory until the decision conditions are met (such as an error status, a latency threshold, or the end of a timeout window), and therefore places higher demands on Collector memory and buffer configuration—decision_wait, num_traces, and memory_limiter in the article are set precisely for this. A common production combination is: use low-ratio head sampling for high-throughput normal traffic, and enable tail sampling as a fallback for errors and slow requests.
Centralized PII Redaction
Rather than requiring every application developer to manually sanitize Prompt strings, deploy a redaction processor in the Collector. Through regex matching or entity recognition, replace credit card numbers, emails, and API keys with masked tokens before they hit disk. Even if full-payload sampling is temporarily enabled for troubleshooting, the compliance posture remains intact.
Unifying Telemetry with a Gateway
Installing a local OpenTelemetry SDK for every service, microservice, and Agent script easily leads to inconsistent naming conventions, diverging sampling rules, and maintenance friction. Moving standard telemetry collection to the network layer and letting an AI gateway handle it uniformly solves this inconsistency.
Bifrost is an open-source AI gateway written in Go, sitting directly between applications and upstream model providers. According to its official benchmarks, it adds only about 11 microseconds of overhead per request under a sustained load of 5,000 requests per second. All requests passing through the gateway are normalized to OpenTelemetry GenAI semantic conventions, and applications only need to point their OpenAI, Anthropic, or LangChain clients at the gateway. It uniformly exports Traces via OTLP, includes built-in Prometheus metrics, and provides a Datadog connector; when it performs automatic cross-provider fallback or semantic cache hits, these events are recorded as a type of Span attribute. Bifrost Edge extends the same governance policies to AI traffic on employee machines, keeping desktop tools, local coding Agents, and terminal scripts following the same application and MCP governance policies as the main gateway.
The AI gateway's role in observability: An AI gateway sits between applications and model providers, is a mandatory node on the network path, and is naturally suited to carrying the responsibility of standardizing telemetry. It can inject standard attributes like model, token, latency, and fallback while forwarding requests, and normalize the varying raw response fields of each provider into gen_ai.* semantic conventions. Compared with installing an independent OpenTelemetry SDK in every microservice, the gateway approach avoids naming divergence, inconsistent sampling rules, and upgrade maintenance costs, while also making it easier to centrally enforce PII redaction and cost attribution. The trade-off is that the gateway becomes a single point, requiring attention to its own performance and availability.
What a Workable Collector Configuration Looks Like
A robust pipeline consists of the application runtime, the AI gateway, and the OpenTelemetry Collector. The following otel-collector-config.yaml shows how to configure tail sampling, attribute normalization, and secure batch export for LLM workloads:
receivers:
  otlp:
    protocols:
      grpc:
        endpoint: 0.0.0.0:4317
      http:
        endpoint: 0.0.0.0:4318

processors:
  # Keep the Collector from running out of bounds under load
  memory_limiter:
    check_interval: 1s
    limit_percentage: 75
    spike_limit_percentage: 15

  # Redact sensitive credentials from attributes
  redaction:
    allow_all_keys: false
    attributes:
      - action: replace
        key: gen_ai.prompt
        pattern: '(?i)(bearer\s+[a-z0-9_\-\.]+)|(api[_-]?key[_-]?=\s*[a-z0-9_\-\.]+)'
        replace: "[REDACTED_SECRET]"

  # Keep high-value anomalies, drop routine noise
  tail_sampling:
    decision_wait: 10s
    num_traces: 10000
    expected_new_traces_per_sec: 2000
    policies:
      # Policy 1: keep all errors
      - name: drop_errors_policy
        type: status_code
        status_code: { status_codes: [ ERROR ] }
      # Policy 2: keep latency outliers (over 5 seconds)
      - name: latency_outliers_policy
        type: latency
        latency: { threshold_ms: 5000 }
      # Policy 3: keep Traces with provider fallback
      - name: fallback_routing_policy
        type: numeric_attribute
        numeric_attribute: { key: "bifrost.fallback_triggered", value_condition: { equal_to: 1 } }
      # Policy 4: keep a 2% baseline sample of normal requests
      - name: probabilistic_baseline
        type: probabilistic
        probabilistic: { sampling_percentage: 2.0 }

  batch:
    send_batch_size: 512
    timeout: 5s

exporters:
  otlp:
    endpoint: "trace-backend.internal:4317"
    tls:
      insecure: false

service:
  pipelines:
    traces:
      receivers: [otlp]
      processors: [memory_limiter, tail_sampling, redaction, batch]
      exporters: [otlp]
This configuration ensures exceptions and failovers are preserved with full fidelity, while routine successful executions are downsampled before storage costs accumulate.
FAQ
What are the OpenTelemetry-defined semantic conventions for LLMs? They are the GenAI semantic conventions under the gen_ai.* namespace, maintained by the CNCF, specifying the Span format, metric instruments, and event structure for model names, token consumption, inference parameters, and tool calls.
Should production Traces store full Prompts and response bodies? By default, no. Storing full conversation payloads for 100% of traffic drives up network and database costs and exposes PII compliance risk. Payloads should only be collected in staging environments or for targeted error samples.
How does OpenTelemetry measure token usage across providers? Through common Span attributes such as gen_ai.usage.input_tokens and gen_ai.usage.output_tokens. Providers report these differently in their raw HTTP responses, and compliant instrumentation libraries and gateways normalize them into standard fields.
What's the difference between head sampling and tail sampling in LLM applications? Head sampling decides at request start and discards calls at a fixed ratio without knowing the final outcome; tail sampling evaluates the entire Trace after completion, can keep 100% of errors, fallbacks, and slow requests, and downsamples repetitive successful calls.
How do you trace streaming responses without overwhelming the Collector? Maintain a single parent Span for the entire streaming HTTP connection, rather than creating a Span per token chunk; record the time to first token as a Span event or attribute to measure TTFT, and close the Span when the stream ends.
How does an AI gateway simplify OpenTelemetry instrumentation? The gateway sits on the network path and automatically emits standardized OpenTelemetry Spans for every request, eliminating the work of installing and configuring independent auto-instrumentation libraries across various microservice codebases, and ensuring consistent attribute naming and metric collection across providers.
One-line Summary
LLM tracing should collect high-value signals like model differences, tokens, and TTFT, and drop noise like chunks and full payloads.
Paragraph Summary
LLM applications generate massive amounts of tracing data in production, and traditional APM based on HTTP status codes can't identify hallucinations, refusals, or Agent stalls. Based on OpenTelemetry GenAI semantic conventions, this article sorts out the high-value signals that should be collected: differences between requested and actual response models, standardized token counts, time to first token (TTFT), Prompt template versions, tool call parameters, and tenant cost attribution, and gives key attributes for four Span types: client, retrieval, tool, and Agent. It also points out four types of noise that must be dropped: creating a Span per streaming chunk, full-payload collection, embedding vectors in attributes, and micro-Spans for framework internal pipelines. On the governance side, it emphasizes tail sampling to retain 100% of error and fallback Traces, keeping only a 1%–2% baseline for normal requests, and centralizing PII redaction in the Collector; finally, it presents the idea of a unified-telemetry AI gateway and a workable Collector configuration example.
Related articles

Amphibious Transforming Drone: Beyond 100x Power Savings, What Are the Real Needs?
Is the amphibious transforming drone just a gimmick? Starting from the 100x power difference of the M4 Morphobot, explore real application scenarios and thesis topic ideas, analyzing boundary conditions where pure drones and pure ground robots both fail.

Warhound Raises $200 Million: Genetically Engineered "War Dogs" Paired with Anduril Gear
Warhound raises $200M, backed by Ben Lamm and Palmer Luckey, to genetically engineer dogs for military and law enforcement use and equip them with Anduril gear. This article analyzes its technology direction, funding logic, and ethical controversy.

Claude API Comes to Google Cloud: IAM Integration and SDK Access Guide
Anthropic hosts the full Claude API on Google Cloud with IAM-controlled permissions and unified billing. This guide covers the Vertex AI and Anthropic-hosted entry points, IAM role configuration, and SDK access.