Perplexity Computer Adds Interactive Charts, Bringing Professional Financial Data Visualization to Conversations

Perplexity Computer adds native interactive charts with TradingView integration for professional financial visualization.
Perplexity has updated its Computer feature with native interactive visualization, letting users generate and interact with dynamic charts without leaving the conversation. The standout addition is financial data support via TradingView Lightweight Charts — an industry-standard open-source library enabling candlestick charts, volume, and moving averages. This compresses the ask-analyze-visualize pipeline into a single interface, lowering the barrier for casual users while giving professionals a fast way to validate ideas. It's a clear signal that AI products are racing to move beyond text output toward actionable, interactive graphics.
Perplexity has rolled out a notable upgrade to its Computer feature: users can now generate interactive charts and data visualizations directly within conversation threads. This means AI-powered Q&A is no longer limited to walls of text or static tables — complex information can now be presented through dynamic, interactive graphics.
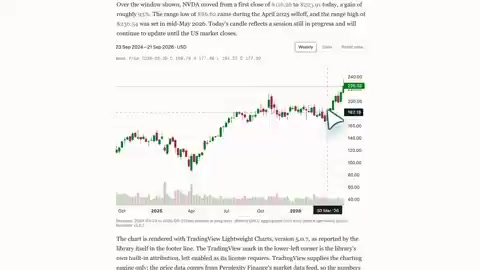
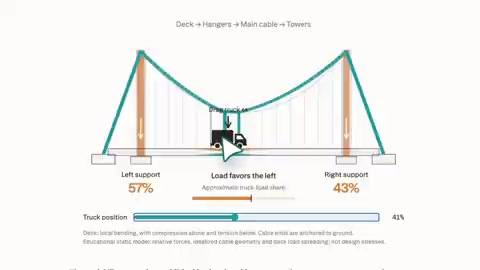
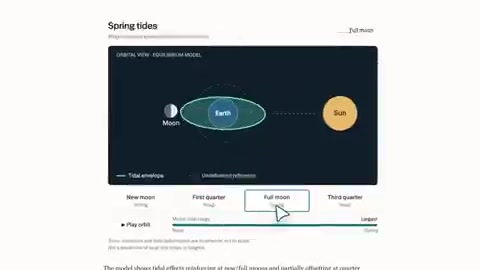
Feature Overview: Native Visualization in the Conversation Thread
In the past, when you asked an AI assistant a data-related question, you'd typically get a lengthy text description, or at best a static image. Digging deeper into the data meant opening another tool and rebuilding the chart yourself.
Perplexity Computer's latest update aims to address this friction — charts are generated directly within the thread and support interactive operations. This "what you see is what you get" experience marks a step forward for AI, evolving from an information retrieval tool into a data analysis tool. For users who work with data frequently, eliminating the need to switch between tools is itself a productivity gain.
What is Perplexity Computer? Perplexity Computer is an agentic AI feature from Perplexity that allows the model to autonomously execute code, call tools, and display results directly in the conversation thread during a session. At its core, it merges a "code interpreter" capability with search-based Q&A. This is conceptually similar to OpenAI ChatGPT's Code Interpreter (now called Advanced Data Analysis), but Perplexity's focus is on combining real-time web search with local computation — enabling generated charts to be based on the latest online data rather than static files uploaded by the user. The addition of interactive chart output represents a further extension of Computer from "can execute code" to "can deliver a usable artifact."
Professional Handling of Financial Data
The most targeted highlight of this update is the specialized treatment of financial data. According to Perplexity, when Computer processes financial data, it leverages TradingView's Lightweight Charts library.
TradingView is a widely recognized charting tool provider in the financial industry, and its Lightweight Charts is a lightweight, high-performance open-source charting library adopted by a large number of trading platforms and financial applications. Using this solution, Perplexity Computer can generate:
- Candlestick charts: The standard way to visualize price movements for stocks, cryptocurrencies, and other assets — intuitively displaying open, close, high, and low prices.
- Volume: Helps users assess market activity and trend strength.
- Moving Averages: A commonly used technical analysis indicator for smoothing price fluctuations and identifying trend direction.
These are foundational tools for technical analysis among finance professionals and investment enthusiasts alike. Choosing a chart library that aligns with industry standards — rather than building a bespoke solution that might not resonate — reflects Perplexity's pragmatic approach to professional use cases.
About TradingView Lightweight Charts TradingView Lightweight Charts is a JavaScript charting library open-sourced by TradingView in 2019, purpose-built for financial time-series data. Its core strengths are its tiny footprint (approximately 40KB compressed) and high rendering performance, capable of handling large volumes of candlestick data without slowing down the page. Built on HTML5 Canvas, it supports both touch and mouse interactions, and is widely used by crypto exchanges like Binance and OKX, as well as numerous financial media market data pages. Compared to the full TradingView charting library, Lightweight Charts strips out complex modules like strategy backtesting and social features, retaining only core visualization capabilities — making it better suited for embedding in third-party applications. Perplexity's choice of this library over general-purpose alternatives like D3.js or ECharts means that the precision and interaction conventions for financial scenarios naturally align with traders' expectations, without requiring additional adaptation.
What This Means
Embedding professional financial charting capabilities directly into the AI conversation flow effectively compresses the "question → analysis → visualization" pipeline. Users can ask in natural language — for example, querying a stock's recent price movement — and immediately see a visualization complete with candlestick charts and moving averages in the same interface, without jumping to a dedicated market data platform.
The value of this kind of feature lies in lowering the barrier to data analysis. For everyday users unfamiliar with professional financial terminal interfaces, the combination of natural language and interactive charts enables them to extract useful information much faster. For power users, it could become a convenient starting point for quickly validating ideas.
Industry Context and Competitive Perspective
Integrating visualization capabilities into AI assistants has become a competitive priority among leading products. Whether it's chart output within code execution environments or visual presentations in data analysis scenarios, every major player is working to move AI output "from text to graphics."
Perplexity's focus on the financial data vertical — and its direct adoption of the industry-standard TradingView stack — represents a differentiated entry strategy. It avoids reinventing the wheel while quickly gaining professional credibility through a proven solution. For Perplexity, which built its name on search and Q&A, expanding into data analysis tools is a meaningful way to deepen user engagement and stickiness.
It's worth noting that the publicly available information at this point comes primarily from official announcements. The actual performance of the feature, the accuracy and timeliness of data sources, and the smoothness of the interactive experience all await broader user testing and feedback.
Summary
The core of this Perplexity Computer upgrade is making interactive chart capabilities native to the conversation, with TradingView Lightweight Charts integrated for financial scenarios to support professional chart types including candlesticks, volume, and moving averages. This is a concrete example of AI Q&A tools evolving into data analysis tools, and reflects how vertical-scenario specialization is becoming an increasingly important dimension of competition in AI products.
Related articles

Random Pruning of the DPO Computation Graph: 1.4x Training Speedup and Lower Peak Memory
DPO training too slow and memory-hungry? This paper proposes a random pruning framework for the DPO computation graph, sampling independently across position, sequence, and branch dimensions; branch pruning achieves a 1.426x step-time speedup and cuts training time by about 30%, with in-depth attribution of memory and time gains.

Why Does JEPA Underperform MLM in Longitudinal EHR Representation Learning?
New study compares JEPA and MLM for longitudinal EHR representation learning on MIMIC-IV: three JEPA variants train stably without collapse but underperform MLM; target size, not heterogeneity, drives prediction error.

Transfer Learning + Visible Light Communication: A New Approach to Energy-Efficient Indoor Positioning
A study proposes a transfer learning-based visible light communication indoor positioning method, achieving 47% accuracy improvement on the BOSCH factory dataset, 67.5% model efficiency under high noise, and introducing the ME composite metric for energy-efficient positioning in energy-constrained industrial IoT scenarios.