Prometheus Monitoring System: A Time Series Database Built with Go
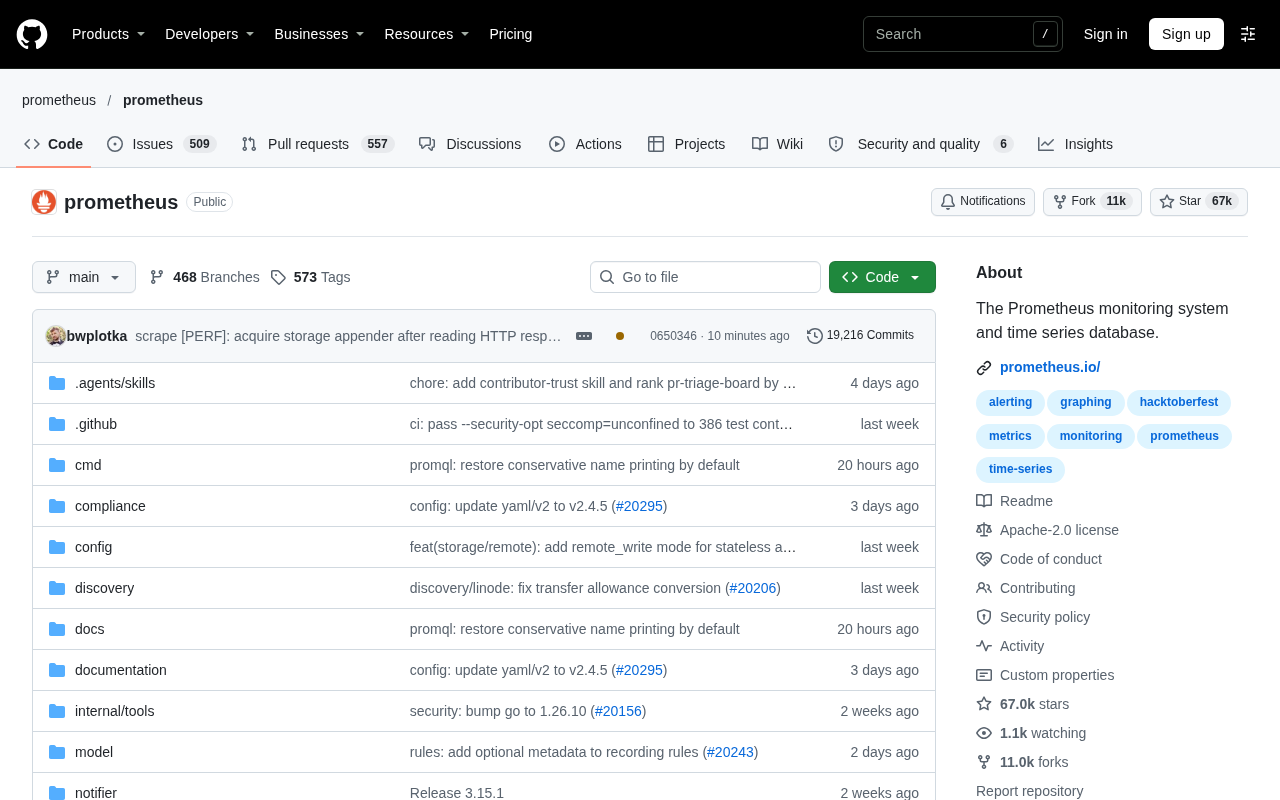
Prometheus became the de facto standard for cloud-native monitoring through pull mode, local time series storage, and PromQL.
Prometheus is a Go-based monitoring system and time series database that has become the de facto standard in cloud-native monitoring thanks to pull-based collection, a multidimensional label model, built-in local time series storage, and PromQL. Its core trade-offs are clear: pull mode makes target liveness itself an observable signal, local storage keeps single-node operation simple, and scaling and long-term retention are handled by the remote write ecosystem. Its Exporter, Alertmanager, Grafana, and OpenTelemetry integrations form a complete observability stack.
Why Prometheus Became the De Facto Standard for Cloud-Native Monitoring
In the cloud-native ecosystem, Prometheus is a name that appears almost everywhere. This monitoring system and time series database, written in Go, has accumulated 66,987 stars and 10,979 forks on GitHub, with 140 new stars in a single day—for a project centered on infrastructure, this level of popularity shows it has hit on a real engineering pain point.
Prometheus's positioning is clear: pull-based metric collection, a multidimensional data model, a built-in time series database, and a fully featured query language, PromQL. It does not aim to be an all-encompassing APM solution; instead, it does one thing—metrics—to the extreme, and then covers the remaining observability dimensions such as logs and tracing through ecosystem composition.
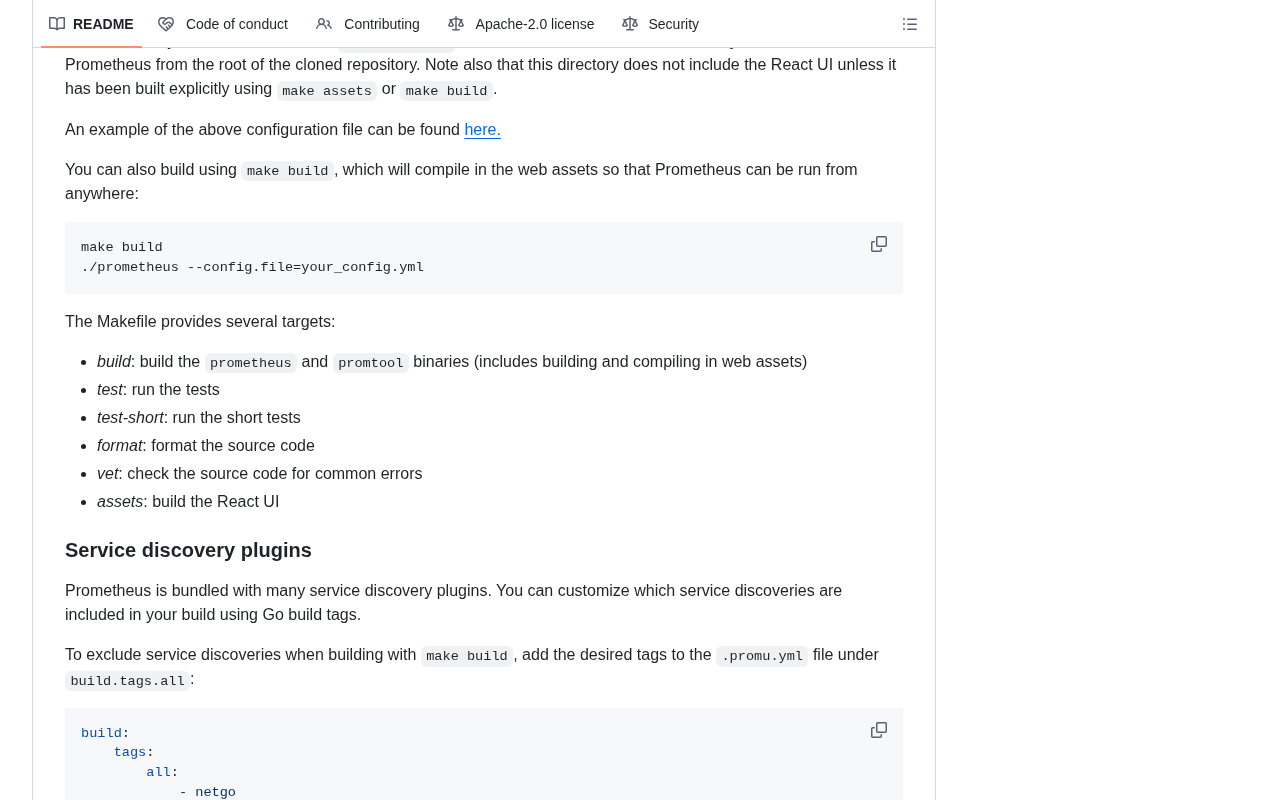
Architectural Trade-offs: Pull Mode and Local Storage
The most frequently discussed design decision in Prometheus is the use of pull mode for metric collection—the server actively scrapes data from target endpoints rather than waiting for clients to push it. The direct benefit of this design is that whether a target is alive is itself an observable signal: a failed scrape means the instance is abnormal, with no need for an additional heartbeat mechanism. At the same time, service discovery is decoupled from configuration, which fits more naturally with dynamic environments such as Kubernetes.
At the storage layer, Prometheus includes a local time series database that stores data in time-based blocks and includes built-in compression. It deliberately does not provide clustered long-term storage, leaving horizontal scaling and long-term retention to the remote write ecosystem. This approach of "a single node strong enough, with scaling provided externally" keeps the core component simple and reliable, and also explains why it can be deployed as a single Go binary with extremely low operational overhead.
Remote write is an extension mechanism Prometheus provides to compensate for the limitations of local storage: in addition to collection and local storage, Prometheus can asynchronously push sample data in batches to remote compatible endpoints such as Thanos, Cortex, Mimir, or various cloud vendor managed services. Because writes are asynchronous, an unavailable remote endpoint does not block local scraping and querying, but attention must be paid to queue backlog, data loss windows, and duplicate data issues. Remote write decouples Prometheus's single-node collection capability from external clustered storage, thereby enabling long-term retention and cross-cluster aggregation while preserving the simplicity of the core component.
PromQL: The Query Layer from Metrics to Insight
If collection and storage are the skeleton, PromQL is the soul of Prometheus. This query language builds a multidimensional data model around labels, supports instant vectors, range vectors, and aggregation operations, and lets users flexibly slice metrics by dimensions such as service, instance, and endpoint.
In practice, alerting rules and dashboards are almost always built on PromQL. Its expressiveness is sufficient to support everything from simple error rate calculations to complex multi-metric correlation analysis, but there is indeed a learning curve—especially for teams new to time series data, understanding vector matching and aggregation semantics requires some investment.
High cardinality refers to an extremely large number of values for a given label, for example using user IDs, request IDs, or full URL paths as labels. Prometheus creates a separate time series for each unique label combination, so high cardinality directly amplifies the in-memory index and inverted index structures, and significantly increases storage and query overhead. Common causes include using unbounded strings as labels, embedding dynamic parameters in labels, and exporters exposing too many dimensions by default. Control measures include dropping or aggregating labels with relabel on the collection side, limiting business metric dimensions, and continuously observing series growth through self-metrics such as prometheus_tsdb_head_series.
Ecosystem and Integrations: More Than a Single Project
Much of Prometheus's influence comes from its ecosystem. The Exporter system allows databases, middleware, hardware, and various other systems to expose metrics in a unified format; Alertmanager handles alert deduplication, grouping, and routing; and Grafana is the most common visualization partner. This combination has become the default answer for cloud-native monitoring.
You may not have noticed that the relationship between Prometheus and OpenTelemetry is becoming closer. As an important implementation of the metrics standard, it is both an important target on the collection side and a common choice for backend storage. For teams planning an observability system, understanding Prometheus's place in multi-source data integration is more valuable than simply memorizing its command-line parameters.
Exporters are a class of small independently running services responsible for converting systems that do not themselves expose Prometheus-format metrics (such as MySQL, Redis, Node hosts, and message queues) into standard /metrics HTTP endpoints for Prometheus to scrape on a schedule. They are usually community-maintained, deployed as a single process near the target, and decouple protocol adaptation from the business system. The breadth of the Exporter ecosystem is the key to Prometheus's rapid coverage of heterogeneous infrastructure: onboarding a new system often only requires finding an existing exporter and configuring a scrape target, without modifying the monitored system itself.
Who It's For and What to Watch Out For
Prometheus is best suited for dynamic, containerized infrastructure monitoring—Kubernetes clusters, microservice architectures, and environments that need to quickly pinpoint metric anomalies. Its single-binary deployment and active community (which still gains steady new attention every day) allow even small and medium-sized teams to get started at low cost.
The areas that require trade-offs are equally clear: local storage is not suitable for very large-scale long-term retention, high-cardinality labels significantly increase memory and storage overhead, and mastering PromQL takes time. Thinking through these boundaries clearly and then deciding whether to introduce remote storage or a managed solution is a key step in the implementation process.
One-line Summary
Prometheus has become the de facto standard for cloud-native monitoring through pull mode, a local time series database, and PromQL.
Paragraph Summary
Prometheus is a monitoring system and time series database written in Go. With pull-based collection, a multidimensional label data model, built-in local time series storage, and the PromQL query language, it has established itself as the de facto standard in the cloud-native ecosystem. Its core trade-offs are clear: pull mode makes target liveness itself an observable signal, local storage keeps single-node operation simple and reliable, and horizontal scaling and long-term retention are left to the remote write ecosystem. The Exporter, Alertmanager, Grafana, and OpenTelemetry integrations formed around it constitute a complete observability combination. The article also points out its boundaries: it is not suitable for very large-scale long-term retention, high-cardinality labels increase resource overhead, PromQL has a learning curve, and remote storage or managed solutions need to be evaluated before implementation.
Related articles
 Tech Frontiers
Stylome Bot Slammed as Useless Junk: Why Do AI Detection Tools Keep Failing?
Reddit users test the Stylome AI detection bot: Gemini-rewritten text judged human-written, consistently low confidence. An analysis of AI text detection's technical dilemmas, privacy concerns, and credibility crisis in community governance.
 Tech Frontiers
When AI Becomes a Productivity Divide: Clarity or "AI Psychosis"?
A civil engineer's deep use of agentic AI boosted efficiency but bred contempt for peers who refuse to learn. Is this clarity or AI psychosis? An analysis of the cognitive and psychological challenges behind the AI productivity divide.
 Tech Frontiers
Opus 5.5 Benchmark Scores Climb, Community Says Its "Weights Are Blessed"
Reddit community discusses Opus 5.5's rising scores on the Benchmaxxing Bench, with users describing its performance as "weights are blessed." This article interprets the community reaction and cautions against conflating benchmark scores with real capability.