Pulsetic RUM: Upgrading from Server Status Monitoring to Real User Experience

Pulsetic RUM unifies real user monitoring and uptime monitoring in one platform to surface what status codes miss.
Pulsetic RUM is a SaaS tool that combines Real User Monitoring with traditional uptime monitoring under a single account. While uptime monitoring only confirms whether a server returns a 200 status code, Pulsetic captures Core Web Vitals, load time percentiles, and JavaScript errors from real devices and networks via a lightweight async script. All metrics support multi-dimensional slicing by page, country, browser, and device. The platform also includes AI-powered natural language querying, cron heartbeat monitoring, domain expiration alerts, and branded status pages — positioning itself as an all-in-one solution for small and mid-sized teams.
Pulsetic RUM: Seeing What Your Real Visitors Actually Experience
Traditional uptime monitoring has a blind spot: a server returning a 200 status code doesn't mean users are having a good experience. A checkout page that responds normally but loads painfully slowly can drive users away — and most monitoring tools won't catch it. Pulsetic RUM aims to close that gap by combining server-side health checks with Real User Monitoring (RUM) in a single platform.
The product recently launched on Product Hunt, earning 95 upvotes and ranking 6th for the day, listed under the Analytics, SaaS, and Developer Tools categories.
The Real Problems a 200 Status Code Can't Hide
Pulsetic's core argument is that "a 200 response code can hide a slow checkout flow." This statement cuts right to the fundamental limitation of status-based monitoring: it answers "is the server alive?" but not "is the user experience smooth?"
This is exactly where Real User Monitoring delivers value. Rather than simulating visits from monitoring nodes, RUM collects actual performance data generated by real visitors in their browsers. What you see isn't performance under ideal network conditions — it's how your site actually feels across a wide range of devices, networks, and geographic locations. For conversion-sensitive businesses like e-commerce and SaaS, even a few hundred milliseconds of latency can have a direct impact on revenue.
Traditional uptime monitoring works by having external nodes periodically send HTTP requests to a target URL. As long as the server returns the expected status code (e.g., 200 OK) within a response time threshold, the service is considered "healthy." This is essentially synthetic monitoring — using controlled machine requests to simulate human visits. Its strengths are clear: it's proactive, continuous, and cost-effective, capable of detecting server outages before real users are affected. But its limitations are equally apparent: it cannot capture JavaScript execution failures during client-side rendering, static asset loading issues caused by CDN cache errors, third-party scripts blocking page interaction, or performance differences driven by real-world network conditions across regions. RUM and traditional uptime monitoring aren't replacements for each other — they're complementary. The former describes "how users actually feel"; the latter answers "is the service still running?"
One Async Script, Multi-Dimensional Insights
Pulsetic RUM's technical implementation is refreshingly lightweight: embed a single async script, and it starts reporting three categories of critical data:
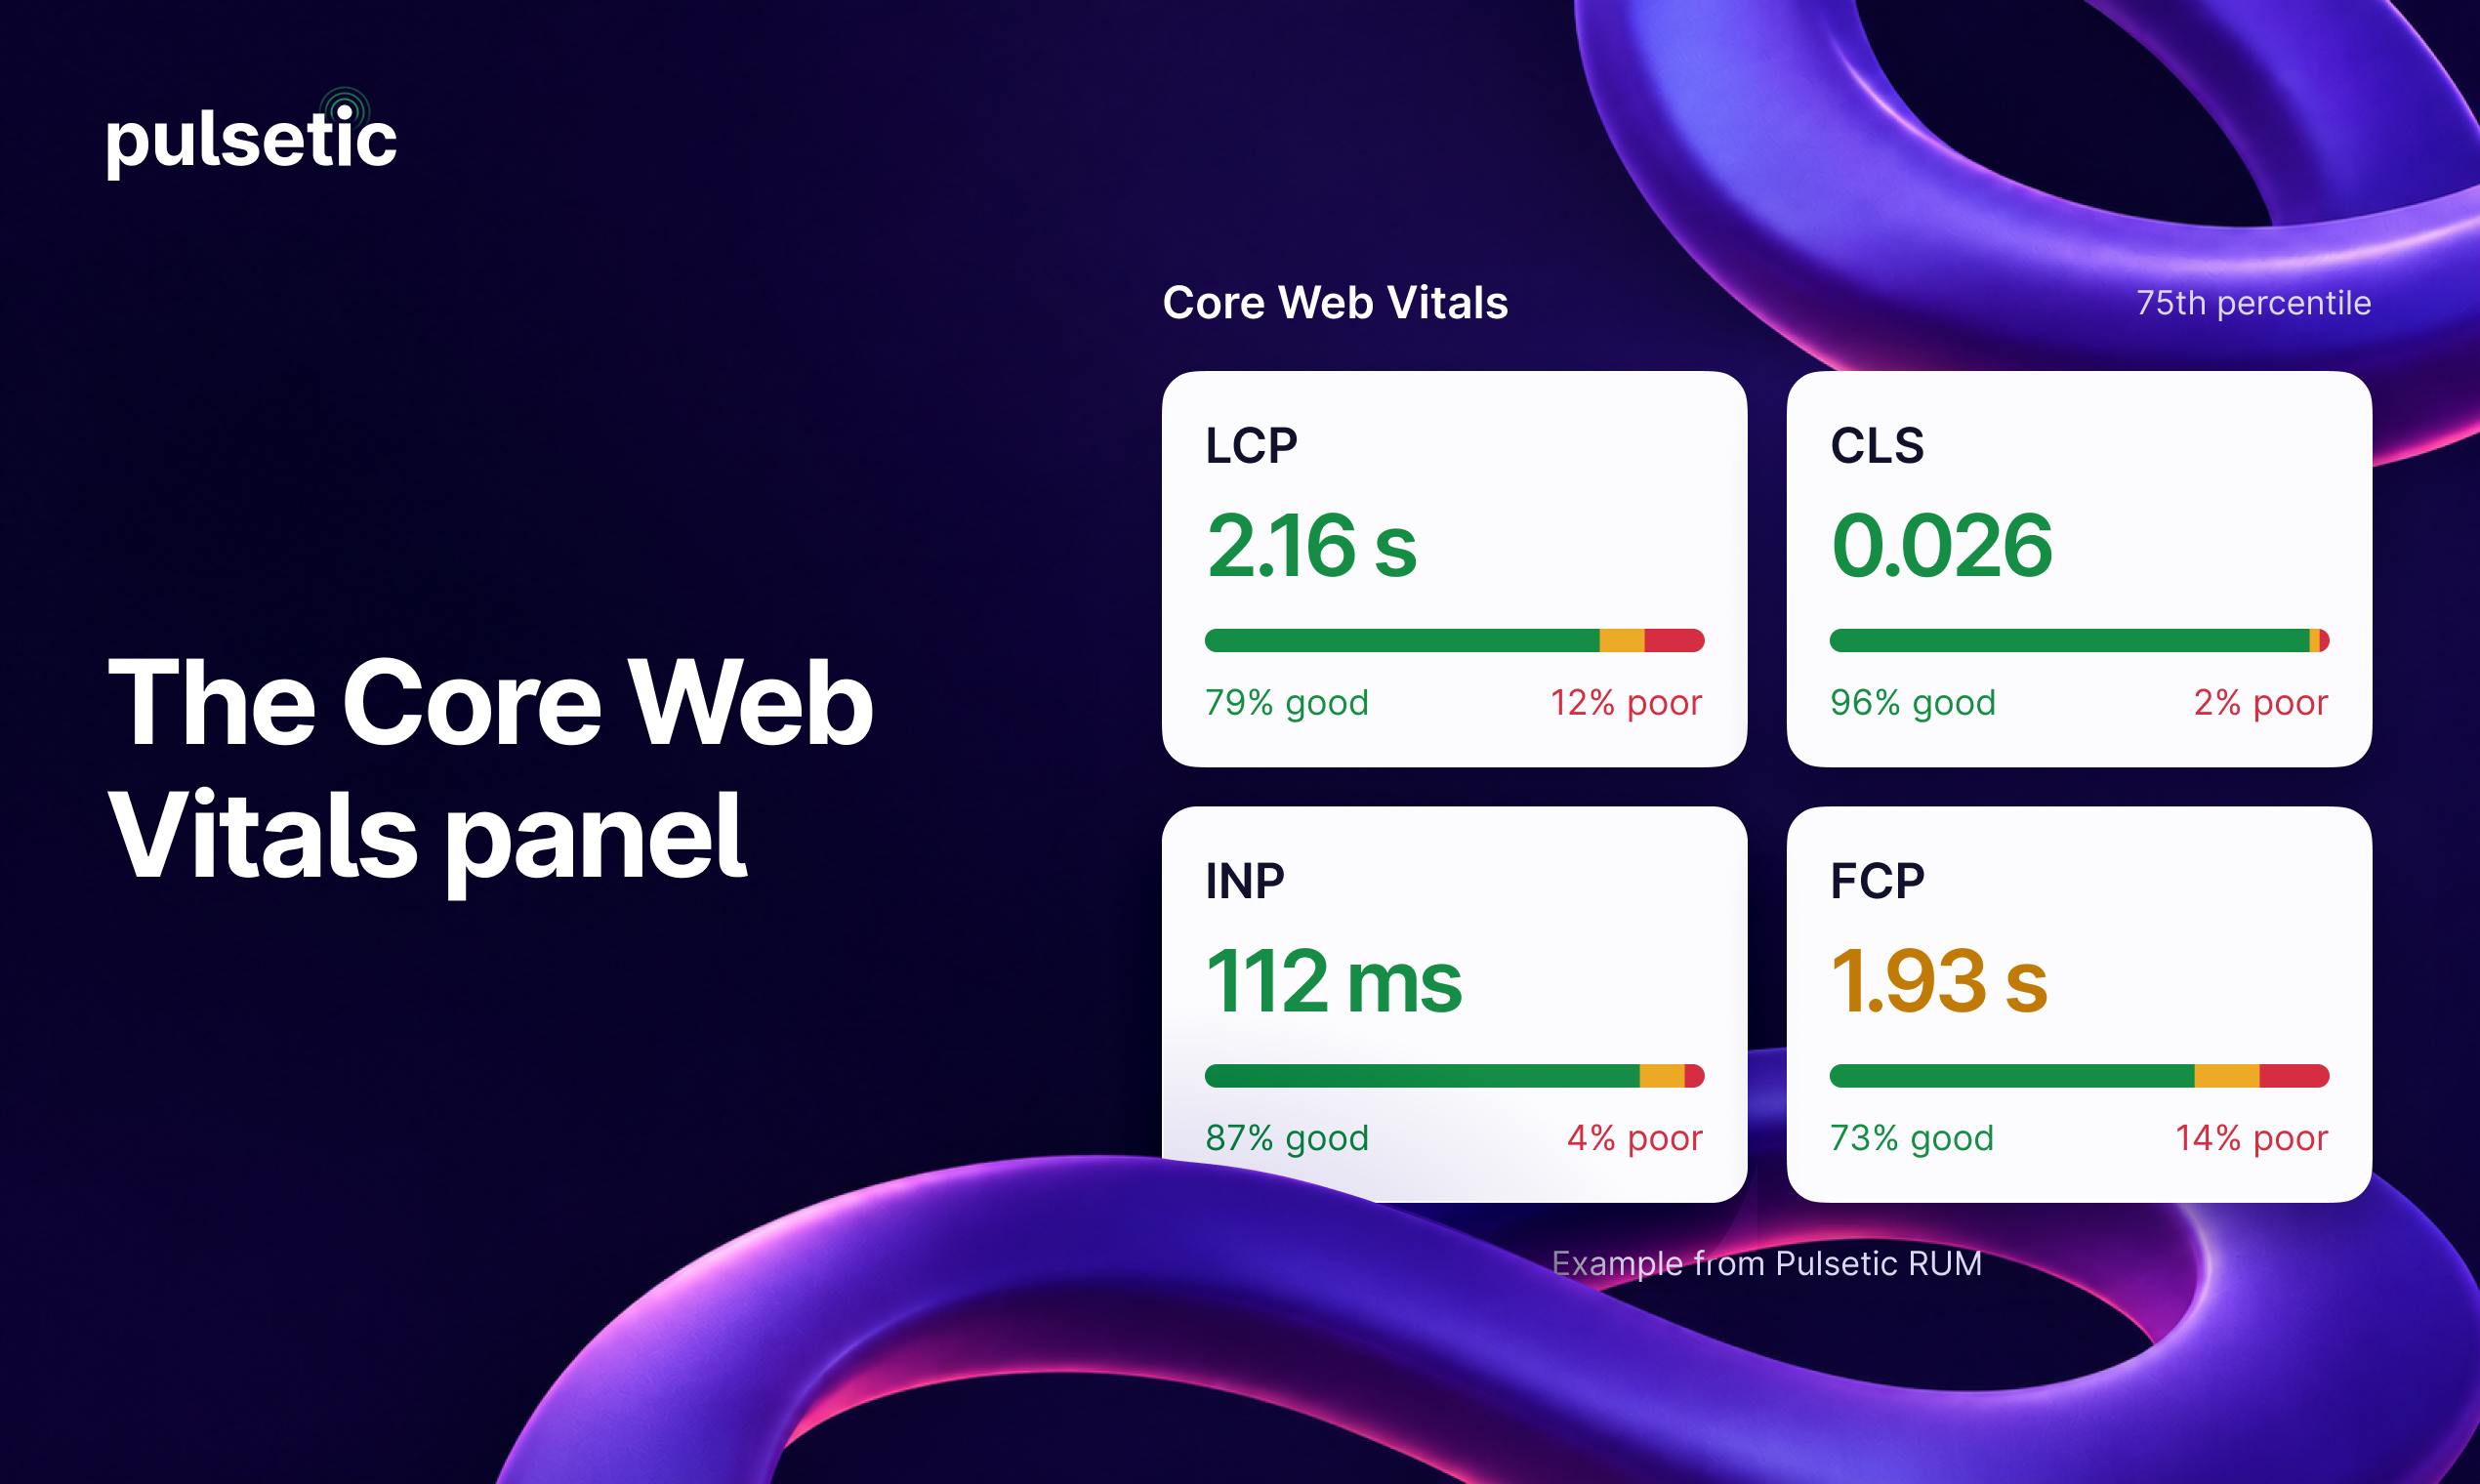
- Core Web Vitals: Google's standardized web performance metrics covering load performance, interactivity, and visual stability — also a significant factor in SEO rankings;
- Load time percentiles: Unlike averages, percentiles (such as P75 and P95) better expose the degraded experience of long-tail users;
- JavaScript errors: Captures front-end errors that real users encounter, not just backend exceptions.
What makes this especially practical is the multi-dimensional slicing capability — all metrics can be broken down by page, country, browser, and device. This transforms troubleshooting from vague conclusions like "the site is slow" into actionable insights like "users in a specific country are experiencing abnormal load times on the checkout page in a particular browser."
Core Web Vitals is a set of user-experience-centered web performance metrics officially introduced by Google in 2020. It currently includes three core dimensions: LCP (Largest Contentful Paint, measuring load performance — ideally under 2.5 seconds), INP (Interaction to Next Paint, measuring interactivity — replaced the old FID metric in 2024, ideally under 200 milliseconds), and CLS (Cumulative Layout Shift, measuring visual stability — ideally below 0.1). What makes these metrics particularly significant is that Google has incorporated them into its search ranking algorithm (Page Experience signals), meaning they function both as user experience benchmarks and as direct influences on organic search traffic — especially critical for e-commerce and content-driven sites. Unlike synthetic monitoring (which simulates visits in controlled environments), RUM collects Core Web Vitals data generated by real browsers on real user devices, capturing the actual impact of factors like mobile networks and low-end hardware.
Ask "What Went Wrong Last Night" in Plain English
The product includes a built-in Pulsetic AI feature that lets users ask questions in natural language — for example, "what went wrong last night" — and receive a readable analysis in return.
This kind of AI-assisted troubleshooting is becoming a standard feature in monitoring tools. For ops and development teams, a middle-of-the-night alert typically means wading through mountains of data. Natural language queries lower the barrier to pinpointing root causes from a sea of metrics, making it especially useful for anyone who doesn't want to jump between multiple dashboards. That said, the real value of such a feature depends on the depth of its analysis — whether it can surface genuine causal conclusions rather than just restating data points is something that ultimately needs to be validated through hands-on use.
Multiple Monitoring Needs, One Account
Beyond RUM, Pulsetic bundles several common operational monitoring capabilities under the same account:
- Cron heartbeat monitoring: Confirms that scheduled tasks are executing as expected;
- Domain expiration alerts: Prevents service disruptions caused by forgotten renewals;
- Branded status pages: Lets you communicate service status transparently to your users.
This "all-in-one" integration approach reduces the overhead of stitching together multiple SaaS tools, and moves Pulsetic from being a simple uptime tool toward a more complete observability platform.
Wrap-Up
Pulsetic RUM has a clear positioning: bridging the gap between traditional uptime monitoring and real user experience. Consolidating server health checks, real user performance data, AI-assisted troubleshooting, and standard operational monitoring into a single account is what differentiates it from pure uptime tools or standalone RUM solutions. For small-to-medium teams that care about conversions but don't want to maintain a complex monitoring stack, this integrated approach has genuine appeal. Of course, the practical usefulness of its AI analysis and the accuracy of its data collection will ultimately be proven — or disproven — by real-world deployments.
Related articles

Amphibious Transforming Drone: Beyond 100x Power Savings, What Are the Real Needs?
Is the amphibious transforming drone just a gimmick? Starting from the 100x power difference of the M4 Morphobot, explore real application scenarios and thesis topic ideas, analyzing boundary conditions where pure drones and pure ground robots both fail.

Warhound Raises $200 Million: Genetically Engineered "War Dogs" Paired with Anduril Gear
Warhound raises $200M, backed by Ben Lamm and Palmer Luckey, to genetically engineer dogs for military and law enforcement use and equip them with Anduril gear. This article analyzes its technology direction, funding logic, and ethical controversy.

Claude API Comes to Google Cloud: IAM Integration and SDK Access Guide
Anthropic hosts the full Claude API on Google Cloud with IAM-controlled permissions and unified billing. This guide covers the Vertex AI and Anthropic-hosted entry points, IAM role configuration, and SDK access.