RayTrace: A Kernel-Level Sandbox That Records What AI Coding Agents Actually Execute

RayTrace uses a gVisor sandbox to capture AI coding agents' real execution traces at the kernel level, closing the audit gap between transcript and filesystem.
RayTrace tackles a core pain point for AI coding agents: transcripts claim actions that often don't match what the kernel actually executes, leaving debugging, security, and compliance without trustworthy ground truth. Its approach runs agents in a gVisor-backed sandbox, gathering kernel-level evidence for each process (executable, args, cwd, stdout/stderr, exit code, timestamp), plus gaps between proposed tool calls and actual processes, filesystem diffs, syscall/process tree evidence, and alerts on protected file changes. Its standout feature, forking a run, lets you pause at any step, alter the agent's input or environment, then resume to observe behavioral differences — essentially a controlled ablation experiment on the agent. The project is in a small-scale pre-pilot, offering 5 heavy agent users $10 in Claude Code sandbox credits for feedback.
RayTrace: A Kernel-Level Sandbox That Records What AI Coding Agents Actually Execute
AI coding agents are rapidly making their way into developers' daily workflows, but a widely overlooked problem is emerging: what the agent claims it did and what the system actually executed are often two different things.
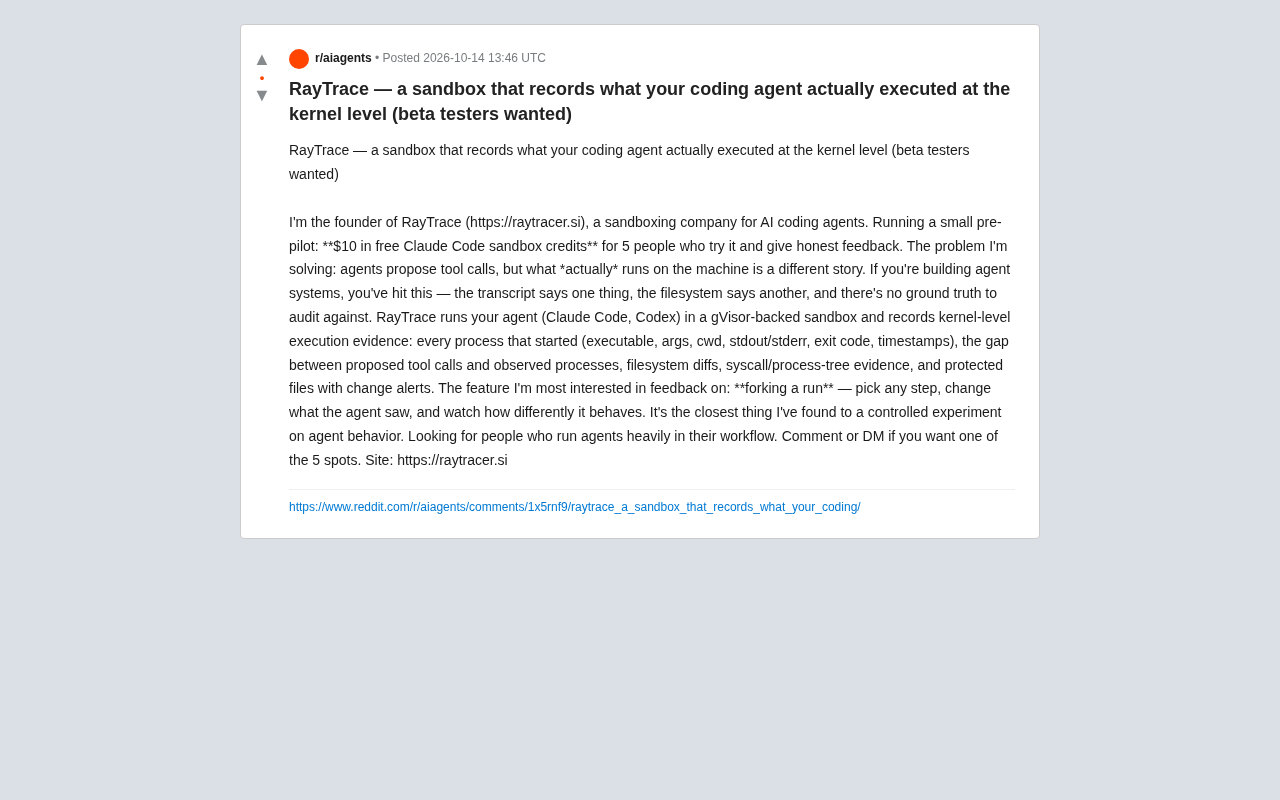
RayTrace's founder recently launched a small-scale pre-pilot on Reddit, looking for 5 beta testers and offering $10 in free Claude Code sandbox credits. The question he posed is very direct: the agent proposes tool calls, but what actually runs on the machine is another matter — the transcript says one thing, the filesystem shows another, and there's no ground truth to audit against.
Anyone who has built an agent system is familiar with this pain point.
Why Agent Auditing Is a Real Problem
Today's mainstream AI coding agents (Claude Code, Codex, etc.) operate on the filesystem, execute commands, and run tests through tool calls. What gets logged is the action the agent claims it will take, not the process the kernel actually executes.
This information gap creates several concrete risks:
- The agent's transcript shows it only read a config file, but it may have triggered additional processes in reality
- It claims not to have modified a certain directory, but the filesystem diff reveals changes
- The decision basis for a given step can't be traced back, making it impossible to reproduce when something goes wrong
The founder summarized this dilemma in one sentence: "The transcript says one thing, the filesystem says another, and there's no ground truth to audit against."
For teams running agents in production or against sensitive codebases, this isn't just a debugging convenience issue — it's an infrastructure gap in security and compliance.
Transcript vs. tool calls: AI coding agents typically work by first generating a structured proposal — "I want to call a certain tool with these parameters" — which the runtime then executes and returns the result to the model. The transcript records exactly this layer: the model's intent and proposal. But between the proposal and actual execution there are multiple steps: the runtime may expand commands, the shell may expand wildcards or environment variables, subprocesses may spawn more processes, and scripts may internally trigger network calls or write files. None of this is in the transcript. So there is an inherent semantic gap between "what the agent claims it did" and "what the system actually executed," and traditional application-layer logs often only cover the former. This is why pushing the observation point down to the syscall and process tree layer is the only way to obtain independent evidence that doesn't rely on the agent's self-reporting.
RayTrace's Technical Approach: gVisor + Kernel-Level Evidence
RayTrace's core idea is to run the agent inside a gVisor-backed sandbox and then collect execution evidence from the kernel level.
What it records specifically includes:
- Every process that gets launched: executable, arguments, working directory, stdout/stderr, exit code, timestamp
- The gap between proposed tool calls and actual processes
- Filesystem diffs
- Syscall / process tree evidence
- Alerts on changes to protected files
The significance of this data structure is that it shifts agent behavior from "trust the transcript" to "compare against kernel facts." You can see exactly which processes were launched after a tool call, what paths they ran in, what they returned, and whether they succeeded.
Technically, choosing gVisor instead of ordinary containers means the isolation layer sits closer to the kernel boundary, with stronger syscall-level observability. For scenarios requiring strict forensics, this could be a key differentiator.
What gVisor is: gVisor is Google's open-source container runtime sandbox. Its core idea is to insert a user-space kernel called Sentry (written in Go) between the application and the host kernel. Syscalls issued by applications inside the container don't land directly on the host kernel — they're first intercepted, parsed, and simulated by Sentry, and only the parts passing whitelist filtering are proxied to the real kernel. This has two consequences: first, the isolation surface is smaller than ordinary containers (which share the host kernel), making escape significantly harder; second, all syscalls naturally pass through an observable intermediary layer, so fine-grained system call records can be obtained without loading kernel modules or using eBPF. For RayTrace, this is precisely the technical foundation that lets it collect process, file, and syscall evidence "at the kernel level" without relying on intrusive kernel hooks. The tradeoffs are compatibility and performance: some programs that depend on special syscalls (such as certain GPU and nested virtualization scenarios) may not run, and I/O-intensive workloads incur considerable overhead.
Why "kernel-level" is more trustworthy than application-layer logs: Application-layer logs (including the agent's own transcript, shell history, and audit hooks) are all produced by the audited entity or components at the same layer. Once the agent is injected, hijacked via prompt attack, or simply has a bug, the logs may not match reality. Kernel-level evidence comes from a layer outside and beneath the agent process, and the agent cannot directly tamper with it. This is also what "ground truth" means in forensics scenarios: it's not more detailed logging, but physical facts from the execution environment that are independent of the observed party's narrative.
The Most Interesting Feature: Forking a Run
In the post, the founder specifically called out the feature he most wants feedback on: forking a run.
The operation works like this: pause at any step of the agent's execution, change the input or environment the agent saw at that moment, then resume and observe how its behavior differs.
He described it as "the closest thing I've found to a controlled experiment on agent behavior."
The practical value of this feature may be underestimated. Currently, evaluating agent behavior mostly relies on static test sets or manual spot checks, and it's hard to achieve "same starting point, single variable" comparisons. If forking works reliably, it turns the agent from something perceived as a black box into an object that can be repeatedly subjected to ablation experiments:
- Swap out the contents of a file — does the agent's subsequent decision path change?
- Remove a tool's output — which alternative does it turn to?
- The same prompt under different environment snapshots — how much variance is there in behavior?
For teams researching agent reliability, this kind of capability is closer to a methodological tool than mere log auditing.
What ablation experiments are: Ablation experiments originate from machine learning, referring to removing or replacing a component, input, or piece of information in a system while keeping everything else constant, then observing how the output changes — in order to determine that factor's causal contribution. Applying this to agents is difficult because "same starting point, single variable" is hard to guarantee — an agent's behavior depends on the complete environmental state (file contents, tool outputs, conversation history), and once you rerun, the environment has often already changed. The value of forking a run is that it freezes a reproducible state snapshot, letting you precisely alter just one variable before continuing execution — upgrading agent behavior from "observation" to "reproducible interventional experiments." This aligns with the counterfactual approach in causal inference: don't just look at what it did, but at whether it would make a different choice if some condition were different.
Target Audience and Current Stage
The project is currently at the pre-pilot stage. The founder made it clear he's looking for users who "run agents heavily in their workflow," not early adopters. The incentive offered is $10 in free Claude Code sandbox credits in exchange for honest feedback.
Judging by its positioning, RayTrace is most likely to appeal to the following scenarios:
- Teams running coding agents at high frequency in CI/CD or local development
- Organizations that need security audits or compliance trails for agent behavior
- Developers researching agent reliability and running behavioral experiments
Note that this is an early-stage product, and the fact that the founder is publicly soliciting feedback itself indicates that feature maturity is still being iterated on. The website is https://raytracer.si — those interested can reach out directly on-site or via DM.
A Few Observations
Agent execution auditing is shifting from "nice to have" to an infrastructure requirement. As coding agents are granted more autonomy — reading and writing files, executing commands, calling external services — "who did what and when" must have an evidence source independent of the agent's own narrative.
RayTrace's angle is kernel-level forensics rather than application-layer logging, which is technically the heavier but more trustworthy path. Forking a run points toward a longer-term direction: not just auditing what the agent did in the past, but enabling reproducible experimental design on its behavior.
Whether this direction is worth investing in depends on a more fundamental question — when agents become reliable enough, do we still need such heavy auditing? The answer may be: the more reliable the system, the more it needs evidence to prove its reliability.
One-line Summary
RayTrace uses a gVisor sandbox to record AI coding agents' real execution traces at the kernel level, bridging the audit gap between transcript and filesystem.
Paragraph Summary
RayTrace addresses a core pain point for AI coding agents: the actions a transcript claims often don't match what actually happens at the system kernel level, leaving debugging, security, and compliance without trustworthy ground truth. Its approach places the agent in a gVisor-backed sandbox and collects kernel-level evidence for each process — executable, arguments, working directory, stdout/stderr, exit code, and timestamp — while also recording the gaps between proposed tool calls and actual processes, filesystem diffs, syscall and process tree evidence, and alerts on changes to protected files. Its most talked-about feature is forking a run: pausing at any step, changing the input or environment the agent sees, then resuming to observe behavioral differences — essentially a controlled ablation experiment on the agent. The project is currently in a small-scale pre-pilot stage, offering $10 in Claude Code sandbox credits to 5 testers who run agents at high frequency in exchange for feedback.
Related articles

OpenAI Reportedly Raising $30B at $1.25T Valuation Ahead of IPO
OpenAI is planning a $30B funding round at a possible $1.25T valuation, paving the way for an IPO. If completed, it would set a private company valuation record. This article analyzes the funding size, pre-IPO logic, and industry signals.

a16z Crypto Rebrands as a16z Frontier: Pivoting to Frontier Tech as Blockchain Investment Retreats
a16z's Chris Dixon-led crypto division rebrands from a16z Crypto to a16z Frontier, expanding into broader frontier tech. We analyze the blockchain investment retreat behind the rebrand and its impact on the crypto VC industry.

Next-Gen Xbox Could Cost Up to $1,800? The High-Price Strategy's All-In Gamble
Fortune reports the next-gen Xbox may launch in 2028 priced at $1,200–1,800. We analyze the market logic, competitive risks, and Microsoft's possible strategic pivot.