Real-World Availability Test of 46 AI APIs: OpenAI Falls Out of Top 15, Regional Differences Are the Real Story
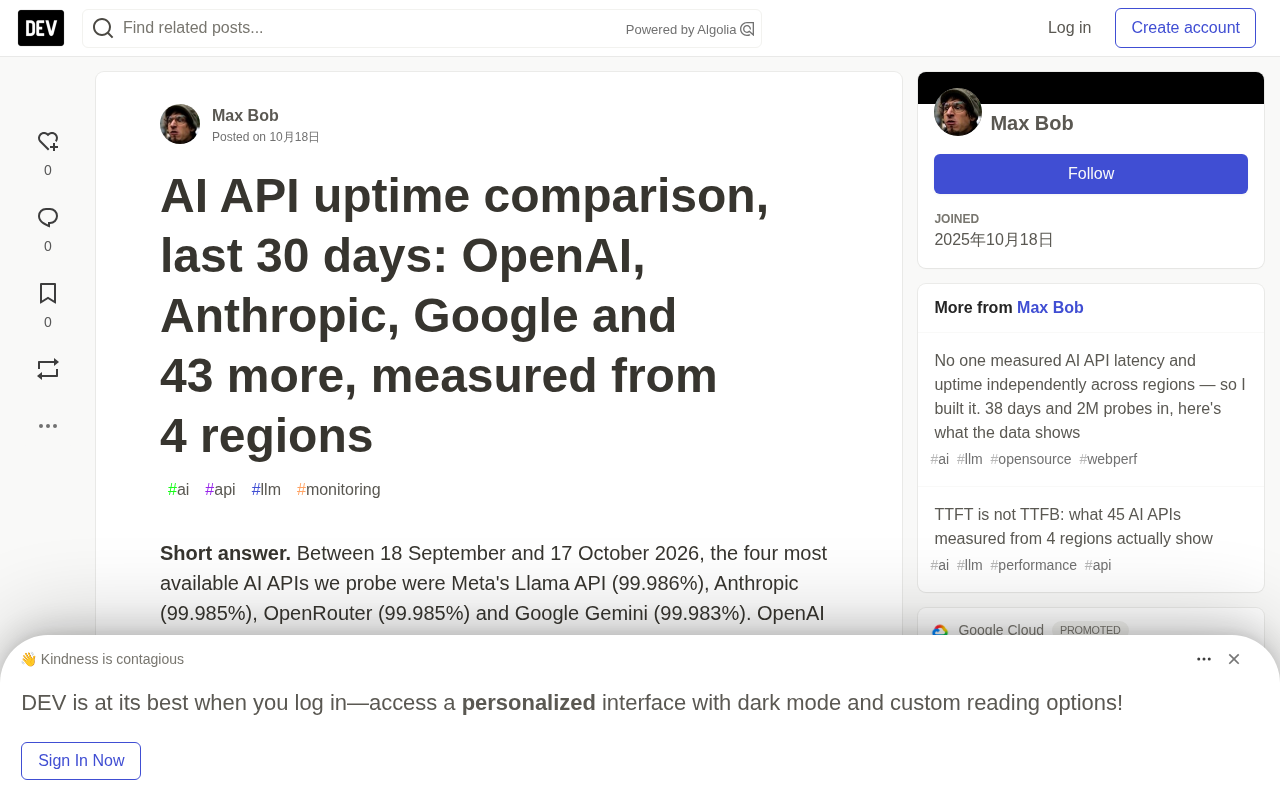
1.58M probes over 30 days show a median availability of 99.90% across 46 AI APIs—regional differences and failure patterns matter more than top rankings.
The independent monitoring project llmlatency.dev ran 1.58M probes against 46 AI inference APIs over 30 days from four cloud data centers every 5 minutes, covering the full chain from DNS to first byte. Top providers differ by only about 24 minutes per month; Meta Llama, Anthropic, OpenRouter, and Google Gemini took the top four, with OpenAI at 18th. Global averages mask regional risk: Tokyo was the worst region for 24 providers and São Paulo for 17. The 51 attributed outages were concentrated among 15 providers, with ByteDance Doubao, 01.AI Yi, and SambaNova accounting for more than half. The monitors stress that network-layer availability is not the same as successful inference—a responding host with a stuck model queue still counts as online—so inference probe data should be used alongside it.
Data Source and Methodology: 30 Days, 1.58 Million Probes in an Independent Monitoring Study
The independent monitoring project llmlatency.dev ran continuous probes against 46 AI inference APIs over a 30-day window from September 18 to October 17, 2026. Data was collected from cloud data centers in four regions—Germany, US Central, Tokyo, and São Paulo—with a request every 5 minutes, totaling 1,580,667 probes.
The probe path covered the full network chain from DNS → TCP → TLS → first byte. Timeouts, connection errors, or HTTP 5xx were counted as failures; 4xx responses were treated as "API responding" since probe requests carry no API key. A failure was attributed to a provider's own outage only when it occurred from 2 or more regions simultaneously and no other provider showed a concurrent failure. This attribution rule effectively rules out regional network issues and upstream common-cause failures.
It's important to be clear that these numbers represent observed availability, not SLA. They reflect what an external client actually sees from four data centers, and absolute values will be better than what a typical mobile user experiences—so cross-provider comparison is the more meaningful part.
Observed availability vs. SLA: Observed availability is the proportion of service reachability actually measured from an external network, calculated directly from probe results. An SLA (Service Level Agreement) is a contractual commitment between a provider and its customer, typically including compensation terms and a specific calculation methodology (e.g., monthly, excluding planned maintenance). SLA figures are often self-reported and filtered by providers, and may exclude brief blips or region-specific failures. As a result, observed availability tends to be lower than official SLA claims but closer to real user experience. When comparing providers, make sure to use observed data from the same source—don't mix third-party monitoring results with vendor-published SLAs.
Overall Rankings: Top-Tier Gaps Measured in Minutes
The top four by 30-day average availability were Meta Llama API (99.986%), Anthropic Claude (99.985%), OpenRouter (99.985%), and Google Gemini (99.983%). OpenAI ranked 18th at 99.930%, falling out of the top 15.
Of the 46 APIs, 24 stayed above 99.9% over the month, with a median of 99.90%. The gap between Anthropic and OpenAI is 0.055 percentage points, which translates to roughly 24 minutes per month. For most applications, a difference of this magnitude is far smaller than the impact of your own code defects or network jitter.
At the bottom, 01.AI (Yi) had availability of 97.275%—about 2.7 percentage points behind the leaders, corresponding to roughly 19 hours of unavailability per month. That's an order-of-magnitude difference.
Converting percentage points to minutes: Each decimal place in an availability percentage represents a different amount of downtime. Based on 30 days (about 43,200 minutes), 1 percentage point equals about 432 minutes, 0.1 points about 43 minutes, and 0.01 points about 4.3 minutes. So while 99.9% and 99.99% look like they differ by only 0.09 points, the actual monthly downtime differs by nearly 39 minutes. The 0.055-point gap between Anthropic and OpenAI cited in this article is how the ~24 minutes figure was derived. Understanding this conversion helps developers translate abstract percentages into perceivable outage durations and assess the real business impact.
Worst Region: The Real Risk Hidden by Averages
Average availability only tells half the story. The data shows that for 24 of the 46 providers, the worst-performing region was Tokyo; for 17, it was São Paulo; and for 5, it was Germany. US Central was never the worst region for any provider.
This distribution has clear engineering implications. If your users are concentrated in Asia or South America, focus on the regional columns, not the averages. Take OpenAI: its global average availability is 99.930%, but in Tokyo it's 99.814%—a gap of nearly 0.12 points. ByteDance Doubao's worst-region availability in São Paulo is 98.891%, significantly below its 99.260% mean.
For product teams serving users in specific regions, deploying multi-region redundancy or choosing providers that perform more stably in that region is more practical than obsessing over global averages.
Attributed Outages: Problems Concentrated in a Few Providers
A total of 51 attributed outages were recorded over the 30 days, spread across 15 providers. ByteDance Doubao (11), 01.AI Yi (10), and SambaNova (9) together account for more than half. The four highest-availability APIs recorded no attributed outages during this period.
Outage count doesn't map perfectly to availability percentages. For example, Cerebras had 99.907% availability but recorded 2 attributed outages totaling 6 minutes, while Moonshot Kimi had 99.850% availability with just 1 outage lasting 36 minutes. The duration of a single failure often matters more to user experience than failure frequency.
How attributed outages are determined: This metric isn't a simple count of all failed requests—it uses multi-region cross-validation to rule out regional network issues and upstream common-cause failures. The specific rule is that a failure is attributed to a provider only when that provider fails simultaneously from 2 or more probe regions and no other provider shows a similar failure at the same time. This design effectively distinguishes "provider outage" from "probe-point network jitter" or "internet backbone failure." As a result, attributed outage counts are closer to genuine provider-side failure events than to all client-perceived errors, letting developers determine whether the failure source is internal to the provider.
Limitations: Network Availability Is Not Inference Availability
The monitors proactively noted several key limitations. First, probe points are cloud data centers rather than consumer networks, so absolute numbers look better than what mobile users see—provider-to-provider comparison is the valid information.
Second, network-layer availability is not the same as successful inference. A host that responds while the model queue is stuck still counts as "online" under this methodology. True inference probes (requests measured by actual time-to-first-token) are reported separately.
Third, 30 days is just one time window and may be subject to sample-period bias. A live page is rebuilt every 30 minutes based on the most recent 24 hours and can serve as a supplementary reference. The dataset is open under a CC-BY-4.0 license with a DOI, and can also be accessed directly in Python via pip install llmlatency.
Practical Guidance for Developers
The value of this data isn't in ranking providers—it's in highlighting two dimensions for selection. The first is the regional perspective: global averages can mask real performance in your target market. The second is failure patterns: frequent short outages and infrequent long outages affect products very differently—the former suits retry mechanisms, while the latter requires degradation plans.
Availability gaps of a few dozen minutes per month among top providers can usually be absorbed in engineering through multi-provider routing and automatic retries. What really deserves caution are providers with availability below 99.5% or single outages lasting more than 30 minutes—they're more likely to become the weak link in your system's stability.
Related articles
uGAP: An AI Platform Unifying 100+ African Geospatial Datasets
uGAP is an African geospatial AI platform by a University of Cape Town team, unifying 120+ African datasets with a Python SDK for discovery, processing, and model training, already used in cyclone flood mapping.

Cursor Can Now Control Your Computer: AI Agents Can Drive Desktop Apps for Testing
Cursor adds desktop control: AI agents can drive desktop apps like the iOS Simulator to test their own features. We analyze the impact on dev workflows, possible technical approaches, and reliability concerns.

Vibecoding a Custom Inference Engine: High Hopes, Harsh Reality
A Reddit developer shares the real experience of vibecoding a custom inference engine: running GGUF Q4 models in the browser with WebGL2 and GLSL, only to fall into tokenizer debugging hell. This article analyzes the engineering challenges of browser-side LLM inference and why cloning llama.cpp is the more rational choice.