Replit Launches New Data Analysis Feature: Generate Insightful Charts Directly from Natural Language

Replit launches a natural language conversational data analysis feature that lets users get analysis results and charts without writing SQL.
Replit showcased its conversational data analysis capability: users ask questions directly in natural language, and the platform returns analyzed data and visualized charts without SQL or repeated rebuilding of analysis workflows. The feature aims to lower the data analysis barrier for business users, especially operations, marketing, and product staff in small and medium-sized teams without dedicated data engineers. The article analyzes conversational analysis as a third path beyond BI dashboards and SQL-driven approaches, noting that its key is understanding business questions and breaking them into analysis steps rather than merely generating charts. It also cautions that output quality depends heavily on data quality and metric definitions, making it suitable for exploratory analysis while key decisions still require manual review. The feature can connect with Replit's cloud development environment so analysis results flow back into application workflows, but official disclosure is limited, and traceability and reproducibility remain to be verified.
Say Goodbye to SQL and Analyze Data by Asking Questions
Replit showcased a new advance in its data analysis capabilities on social media: users can directly submit data analysis requests to the platform, such as "How is customer churn looking?", and Replit will return analyzed data and intuitive charts. The entire process requires no SQL queries and no repeatedly rebuilding analysis workflows.
The positioning of this feature is clear—let business users skip the technical barrier and focus their energy on driving business outcomes. The official tweet reads: "Just ask for analyzed data and insightful charts. No SQL, no rebuilding over and over again."
From a product logic perspective, this continues Replit's recent direction: embedding AI Agent capabilities into development and analysis workflows so that non-technical users can complete tasks that previously required engineer involvement.


The "Conversational" Inflection Point in Data Analysis
Traditional data analysis tools mostly take two forms: one is BI dashboards, with fixed metric visualization and limited flexibility; the other is SQL/code-driven, which is flexible but has a high barrier to entry. What Replit emphasizes this time is a third path—natural-language-driven on-demand analysis.
The key to this path is not "being able to generate charts," but "being able to understand business questions and break them down into analysis steps." Customer dropoff itself is a metric that requires definition: should it be calculated by user activity, by subscription cancellation, or by behavioral decay? Users only need to ask the question, and the model needs to complete metric selection, data retrieval, and visualization presentation on its own.
Replit's official tweet did not disclose underlying implementation details, but judging from its product matrix, this most likely relies on its Agent infrastructure to chain data queries, Python analysis scripts, and chart rendering into an automated pipeline.
Natural Language to SQL (NL2SQL) is one of the core technologies behind conversational analysis. It refers to automatically translating users' natural language questions into executable database queries. A typical process includes intent recognition, schema linking (mapping entities in the question to database tables and fields), query generation, and validation. The main challenges of this technology lie in the semantic gap between business terminology and database schemas, the complexity of multi-table joins, and ambiguity resolution. In recent years, the introduction of large language models has significantly improved the accuracy of NL2SQL, but in scenarios involving complex aggregations, nested queries, or vague metric definitions, manual validation is still required. Replit's conversational analysis very likely builds on NL2SQL by adding Python analysis script generation and chart rendering, forming an end-to-end automated pipeline.
Metric Definition is an easily underestimated but crucial concept in data analysis. The same business question, such as "customer churn," may lead to completely different conclusions under different definitions: defined by subscription cancellation, by N consecutive days of inactivity, or by a decline in purchase frequency. Inconsistent definitions can cause data mismatches across departments and make analysis conclusions incomparable. Traditional BI dashboards solidify definitions through predefined metrics, while conversational analysis leaves metric selection to the model to complete automatically, which brings flexibility but also introduces the risk of metric drift. Therefore, mature conversational analysis products usually need an accompanying semantic layer that codifies business definitions in a structured way for the model to call on rather than improvise.
Who Needs This Kind of Tool Most
The most direct beneficiaries are operations, marketing, and product staff in small and medium-sized teams. These roles often have clear data questions but lack dedicated data engineer support, making SQL the biggest efficiency bottleneck.
The second type of scenario is rapid validation. When business hypotheses need data support, waiting for scheduling to write queries often takes several days, while conversational analysis can compress the feedback cycle to minutes.
What needs to be viewed calmly is that the output quality of natural language analysis tools depends heavily on underlying data quality and the model's understanding of business context. When metric definitions are vague and data sources are messy, the generated charts may look professional but the conclusions may be unreliable. Such tools are suitable for exploratory analysis, and for key decisions it is still advisable to manually review definitions and data sources.
Exploratory Data Analysis (EDA) and confirmatory analysis are two basic paradigms of data analysis. Exploratory analysis emphasizes discovering patterns, anomalies, and correlations in data without clear hypotheses, and places high demands on flexibility and iteration speed; confirmatory analysis conducts statistical testing or causal inference on existing hypotheses and places high demands on rigor and reproducibility. Conversational analysis tools are naturally suited to exploratory scenarios—ask quickly, generate charts quickly, and adjust direction quickly. But in confirmatory scenarios, the transparency of analysis logic, the correct selection of statistical methods, and the auditability of results are all crucial, and such tools are currently not yet fully capable of handling these. Understanding this distinction helps business teams reasonably position the boundaries of tool usage.
Impact on Development Workflows
Replit's core user base is developers and programming learners. The extended value of this feature lies in incorporating the data analysis step into the original application-building workflow. A team building a SaaS tool can complete both application development and operational data analysis on Replit, reducing the cost of switching tools.
The tweet's phrase "No rebuilding over and over again" also hints at this: analysis workflows are reusable and do not need to be built from scratch every time.
From a competitive perspective, conversational data analysis is not unique to Replit; multiple AI programming platforms and BI vendors are betting on this direction. Replit's differentiator is its integrated cloud development environment—analysis results can flow directly back into applications or workflows rather than remaining only at the reporting layer.
Limitations and Observations
Official information is currently limited, coming only from a single tweet, and lacks details on feature boundaries, supported data source scope, and accuracy validation. For scenarios requiring rigorous auditing, the transparency of conversational analysis remains an unresolved issue: whether users can trace each step of the analysis logic and reproduce results determines whether the tool can move from "impressive demo" to "production-ready."
What is certain is that the barrier to data analysis is being continuously lowered by AI. For business teams, the real competitive point will shift from "whether we can get data" to "whether we can ask good questions."
One-line Summary
Replit launches a natural language conversational data analysis feature that lets users obtain analysis results and charts without writing SQL.
Paragraph Summary
Replit showcased its conversational data analysis capability on social media: users ask questions directly in natural language, and the platform returns analyzed data and visualized charts without requiring SQL or repeated rebuilding of analysis workflows. The feature is positioned to lower the data analysis barrier for business users, with the most direct beneficiaries being operations, marketing, and product staff in small and medium-sized teams that lack dedicated data engineer support. The article analyzes conversational analysis as a third path beyond BI dashboards and SQL-driven approaches, pointing out that its key lies in understanding business questions and breaking them down into analysis steps rather than merely generating charts. It also cautions that output quality depends heavily on data quality and metric definitions, making it suitable for exploratory analysis while key decisions still require manual review. In addition, the feature can connect with Replit's cloud development environment so that analysis results flow back into application workflows, but official disclosure is currently limited, and traceability and reproducibility still need verification.
Related articles
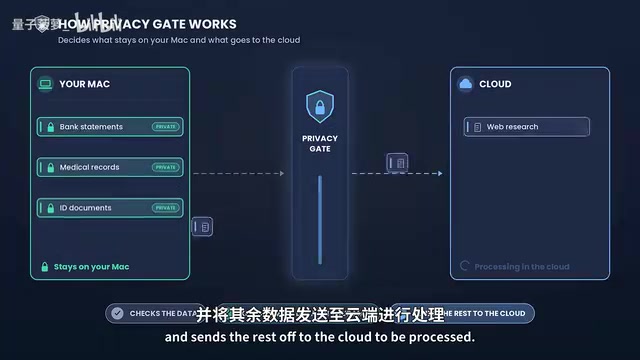
Perplexity Hybrid Compute Tested: Privacy Data Never Leaves the Mac
Perplexity Hybrid Compute tested: how PrivacyGate intercepts sensitive data, how local and cloud models divide work, model differences on 16GB vs 32GB Macs, and privacy protection in real scenarios like bank statements and medical records.

Big Fat Fish Roasts Mainstream LLMs at Home and Abroad: Doubao Takes the Crown, DeepSeek Tied for First
Bilibili creator Big Fat Fish roasts mainstream LLMs: Doubao tops for emotional value, DeepSeek ties first for open-source value, with ERNIE, Hailuo, Yuanbao, Kimi, Qwen, Kling, Claude, Gemini, and Grok each branded with a distinct persona.

How to Truly Test AI Agents Before Production? A Practical Testing and Monitoring Framework
BotGage founder Pramin Pradeep shares a three-step framework for testing AI Agents before production: Agent registration visibility, red teaming, and production observability — plus a real case cutting QA costs from $180K to $80K and an analysis of IT roles shifting to Agent supervisors.