Tractionwave: Using AI Attention Heatmaps to Predict Ad Performance Before Launch

Tractionwave uses AI to generate ad attention heatmaps in seconds, helping teams predict visual performance before launch.
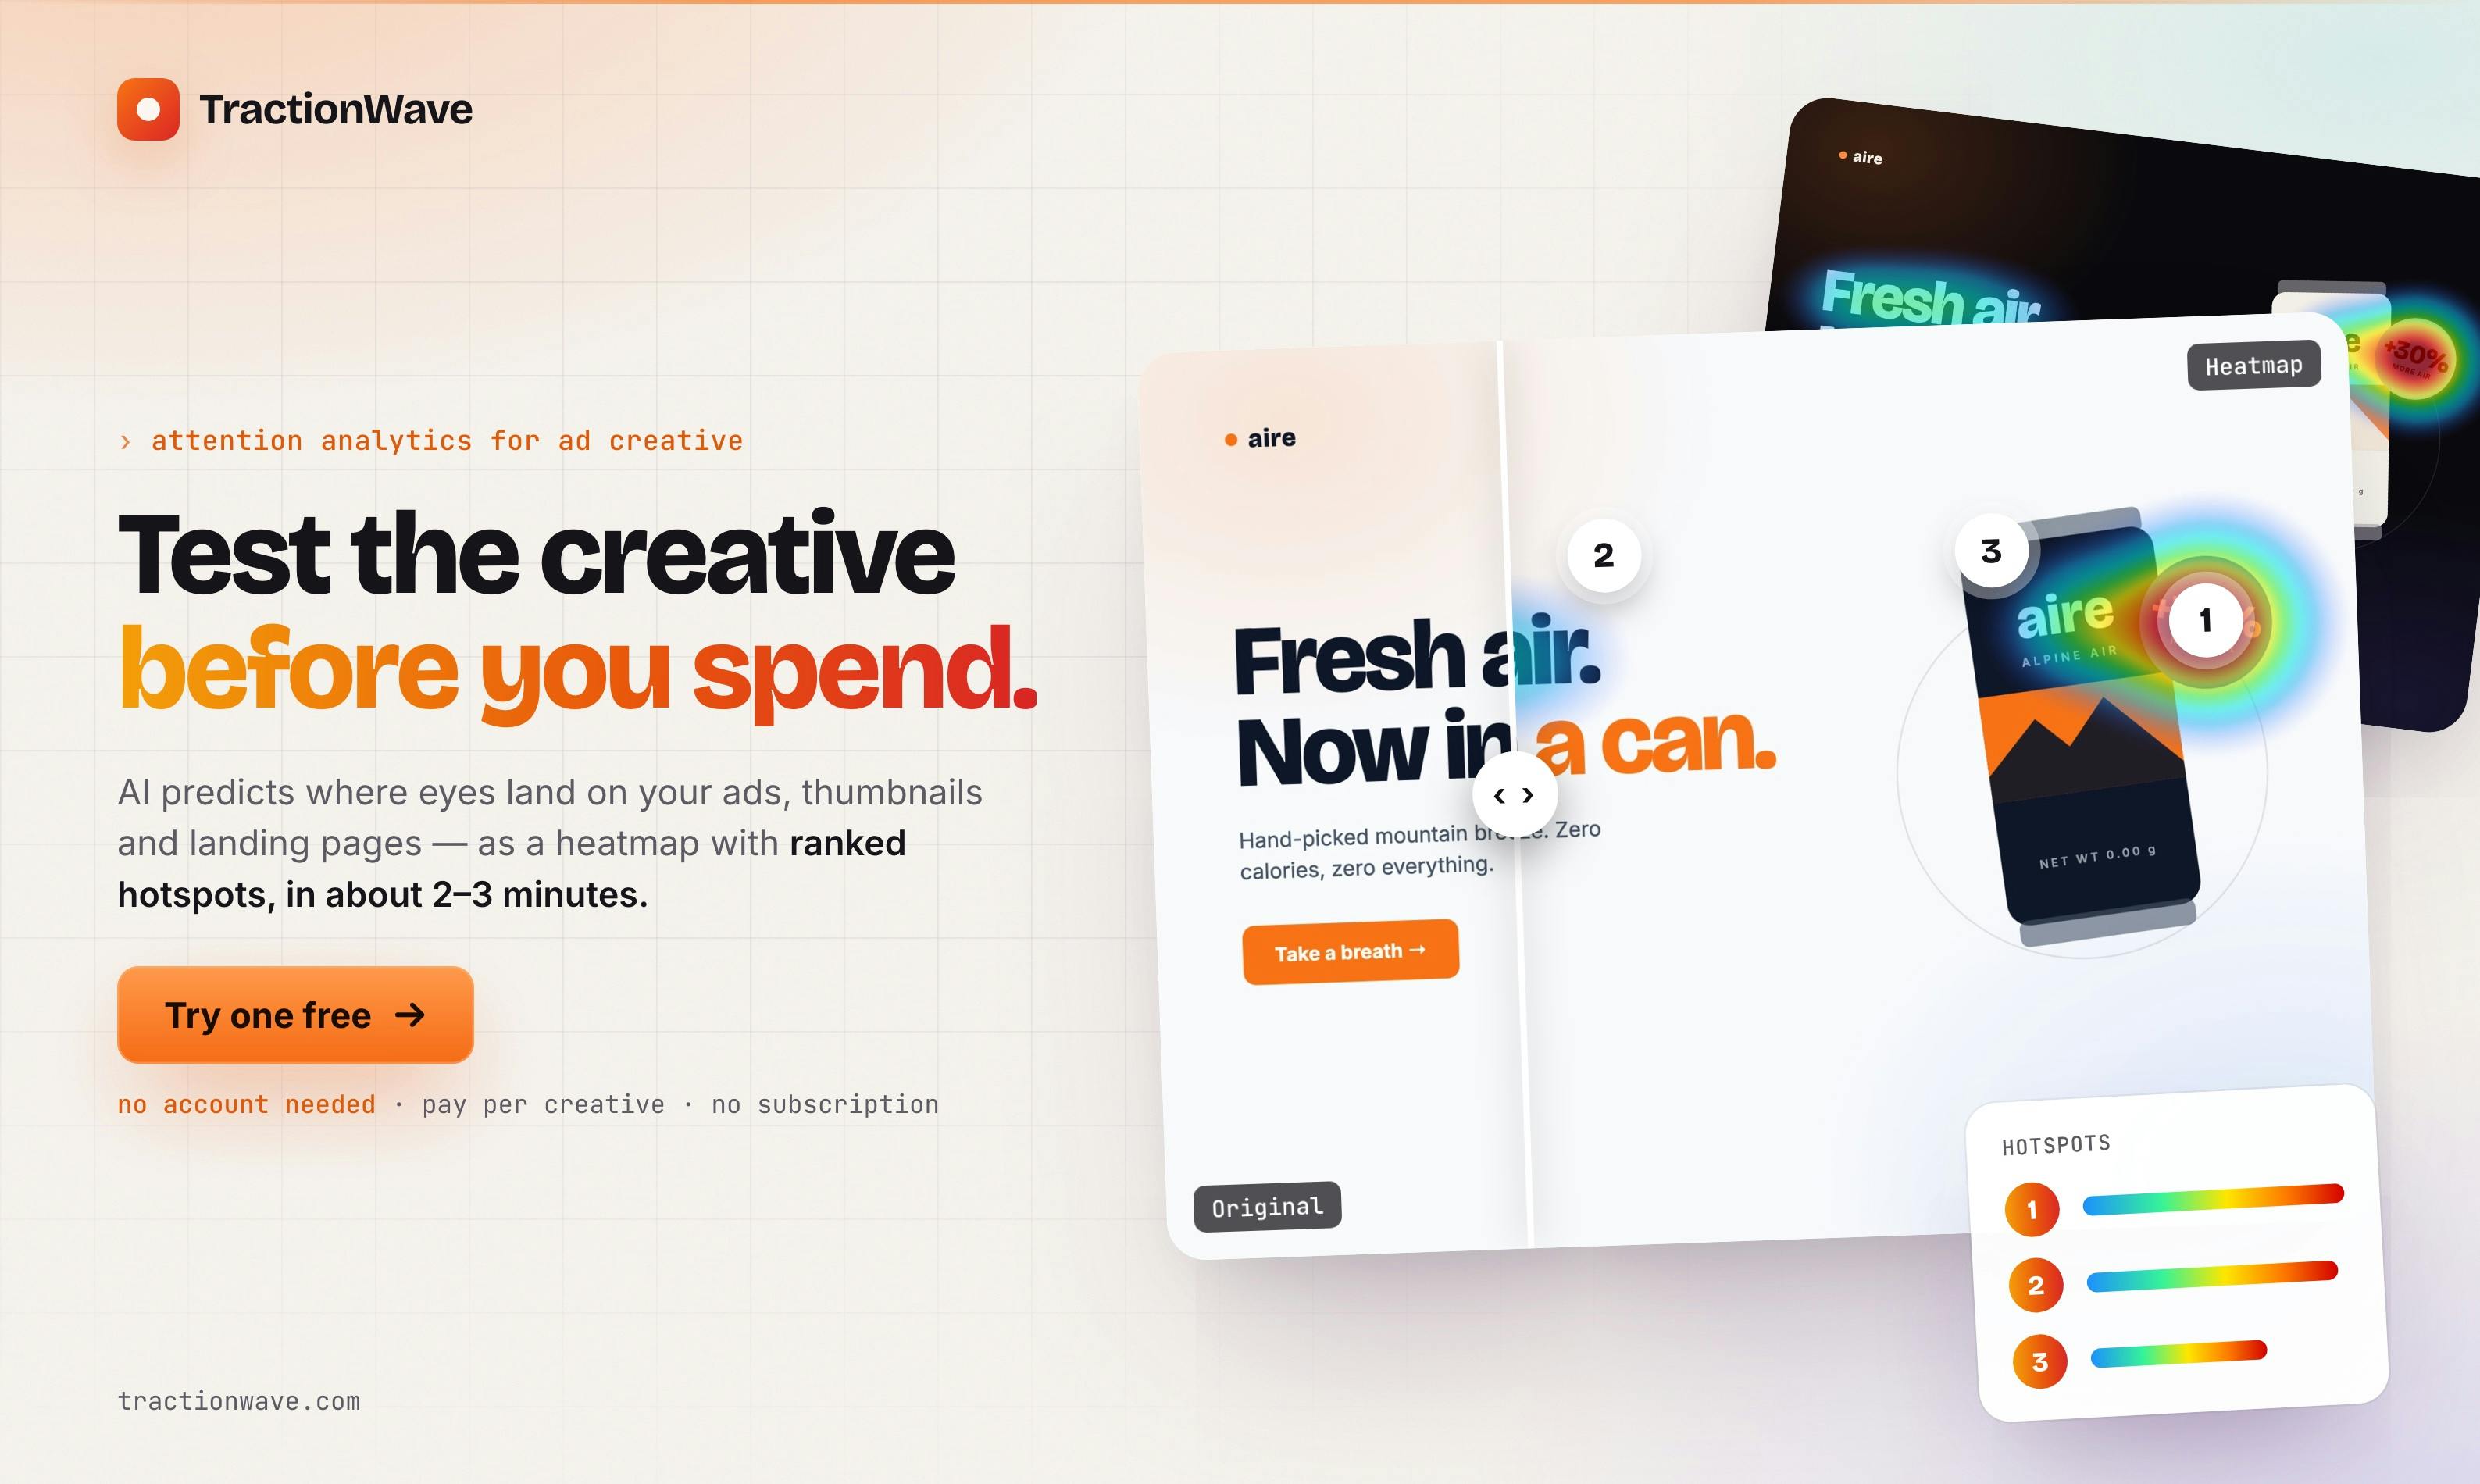
Tractionwave is an AI tool for designers, UX practitioners, and marketers that predicts how users' visual attention will be distributed across an ad creative — before the budget goes live. Using machine learning models trained on eye-tracking data, it compresses what traditionally required days of user testing into seconds-fast heatmaps and ranked hotspots. The article also notes key limitations: AI saliency prediction is probabilistic and captures only instantaneous visual prominence, not conversion effectiveness, reading order, or emotional response. As an early-stage product, validating its predictions against historical campaign data is recommended before integrating it into decision-making workflows.
An AI Tool That Helps You Understand Your Ads Before You Spend
The biggest anxiety in advertising isn't the budget itself — it's not knowing whether that money will be wasted. Before a creative goes live, no one can say for certain where users' eyes will land: the product, the copy, or some irrelevant background detail. Tractionwave aims to solve exactly this longstanding problem: using AI to predict users' visual attention before the budget goes live, presenting results as heatmaps and ranked hotspots.
According to its official description, the product evaluates ads and marketing visuals, generating attention heatmaps and ranked attention hotspots within seconds. The core promise is straightforward — "Know it gets seen before the budget goes live." It has currently received 73 upvotes on Product Hunt, ranking 15th, and is categorized under design tools, UX, and marketing.
The Logic Behind AI Attention Prediction
Attention prediction isn't a new concept. The traditional approach relies on eye-tracking experiments: recruit real users, have them wear devices, record where their eyes move across a screen, and aggregate the data into heatmaps. This method is accurate but expensive, time-consuming, and impossible to scale across every piece of creative you want to test.
Tools like Tractionwave take a different approach — using machine learning models to simulate visual saliency, or how the human eye responds when first encountering an image. These models are trained on large-scale eye-tracking datasets and can predict which areas of an image are most likely to attract attention at first glance, without requiring any human participants. The output isn't just a vague heat zone; it includes a ranked list of hotspots, making it clear which element is actually the most eye-catching.
For marketing teams, this means a quantifiable pre-flight check: if a brand logo or call-to-action (CTA) button doesn't fall within a hotspot area, it signals a problem with the visual hierarchy — one that can be fixed before launch, rather than diagnosed in a post-campaign retrospective.
Visual saliency is a concept rooted at the intersection of neuroscience and computer vision. When the human visual system scans a new scene, it completes a rapid "pre-attentive" filtering process within roughly 100–150 milliseconds — regions with high color contrast, sharp edges, a sense of motion, or strong differentiation from surrounding areas trigger the visual cortex first, forming what's known as "bottom-up" attention. This differs from "top-down" attention, which is driven by task goals and conscious intent (such as a user actively searching for pricing information). AI saliency models primarily capture the former — the unconscious, instinctive visual pull that determines whether an ad makes a strong first impression. Widely used saliency models in the industry include deep learning-based approaches such as DeepGaze and ML-Net, both trained on large-scale eye-tracking datasets (e.g., MIT300, SALICON), and capable of predicting attention distribution on static images at near-human average accuracy.
Who Is This For
Tractionwave's Product Hunt category tags point to an audience at the intersection of three groups: designers, UX practitioners, and marketers.
Designers can use it to verify whether their composition places visual weight in the right places. UX teams can check the information hierarchy of landing pages or interface elements. And marketers running paid campaigns can use it for pre-flight A/B creative screening — selecting the candidate whose attention distribution best matches their goals before committing to a spend.
"Results in seconds" is the key selling point for tools in this category. Compared to user testing that can take days, near-instant feedback allows creative iteration to become part of the everyday workflow, rather than existing as a separate, costly phase.
Limitations to Keep in Mind
It's worth being clear: AI attention prediction is inherently probabilistic guidance, not a substitute for real user behavior. What the model predicts is "visual saliency at first glance" — which parts of an image are more conspicuous. But conspicuous doesn't mean effective. A flashy background might capture all the attention while contributing nothing to conversions.
Additionally, these models typically predict instantaneous attention on static images, and struggle to account for deeper factors like reading order, emotional response, or brand recall. In other words, this is an efficient "first-pass filter" — it helps you eliminate obviously flawed creatives, but it can't fully replace real-world campaign testing and data validation.
Based on publicly available information, Tractionwave appears to be at an early stage — 73 upvotes, a single maker, and no disclosed pricing or model details all suggest it still needs more real-world use cases to demonstrate its predictive accuracy. For small teams on tight budgets who produce marketing creatives frequently, it offers a low-cost pre-check worth trying. But before incorporating it into your decision-making workflow, it's worth running a few validation rounds using historical creatives where you already have actual campaign data — to confirm how well the predictions correlate with real performance.
It's worth highlighting a gap that's often overlooked: there's a significant distance between visual saliency prediction and advertising effectiveness. "Being seen" and "being understood" are two different things, and "being understood" and "driving action" are two more. Research in behavioral economics and advertising effectiveness consistently shows that attention dwell time, the context in which attention occurs (the user's emotional state and intent at that moment), and the existing relationship between the brand and the user often have a greater impact on conversion than visual saliency rankings alone. The more mature approach in the industry, therefore, is to use tools like this as a filter for "eliminating obvious mistakes" rather than a decision-maker for "selecting the best creative." Ensuring a CTA button isn't buried by a competing background is a task it can reliably handle; judging which line of copy will resonate more deeply with users is well beyond its scope.
Summary
Tractionwave represents a clear trend: taking user research methods that were once expensive and slow, and compressing them into seconds-fast, scalable everyday tools through AI. Its value isn't in providing definitive answers — it's in transforming the question "will this ad actually get noticed?" from a gut-feel judgment into a visual, discussable reference point. As marketing budgets face increasing scrutiny, there's a genuine place for pre-flight tools like this in the workflow.
Related articles

Random Pruning of the DPO Computation Graph: 1.4x Training Speedup and Lower Peak Memory
DPO training too slow and memory-hungry? This paper proposes a random pruning framework for the DPO computation graph, sampling independently across position, sequence, and branch dimensions; branch pruning achieves a 1.426x step-time speedup and cuts training time by about 30%, with in-depth attribution of memory and time gains.

Why Does JEPA Underperform MLM in Longitudinal EHR Representation Learning?
New study compares JEPA and MLM for longitudinal EHR representation learning on MIMIC-IV: three JEPA variants train stably without collapse but underperform MLM; target size, not heterogeneity, drives prediction error.

Transfer Learning + Visible Light Communication: A New Approach to Energy-Efficient Indoor Positioning
A study proposes a transfer learning-based visible light communication indoor positioning method, achieving 47% accuracy improvement on the BOSCH factory dataset, 67.5% model efficiency under high noise, and introducing the ME composite metric for energy-efficient positioning in energy-constrained industrial IoT scenarios.