Waymo Safety Data Hits New Milestone: Severe Injury Crash Rate 20x Lower Than Human Drivers

Waymo's severe injury crash rate is 20x lower than humans across 270 million miles, continuously improving with mileage.
Waymo's latest operational data reveals that its autonomous vehicles have a 20x lower severe injury collision rate than human drivers across 270 million miles of real-world driving. This advantage evolved from roughly 10x in early stages to 13x at 170 million miles. Mileage growth brings more long-tail scenarios and edge cases into the training and simulation loop, forming a flywheel where more driving leads to stronger models and lower accident rates. Choosing severe injury crash rate as the core metric reflects its direct link to social cost and public trust. Sensor optimization, simulation-real data feedback, and cautious operational expansion together drive the safety leap.
How much safer is autonomous driving compared to human driving? Waymo is offering an increasingly compelling answer through its accumulating operational data.
Core Data: How the 20x Safety Advantage Evolved
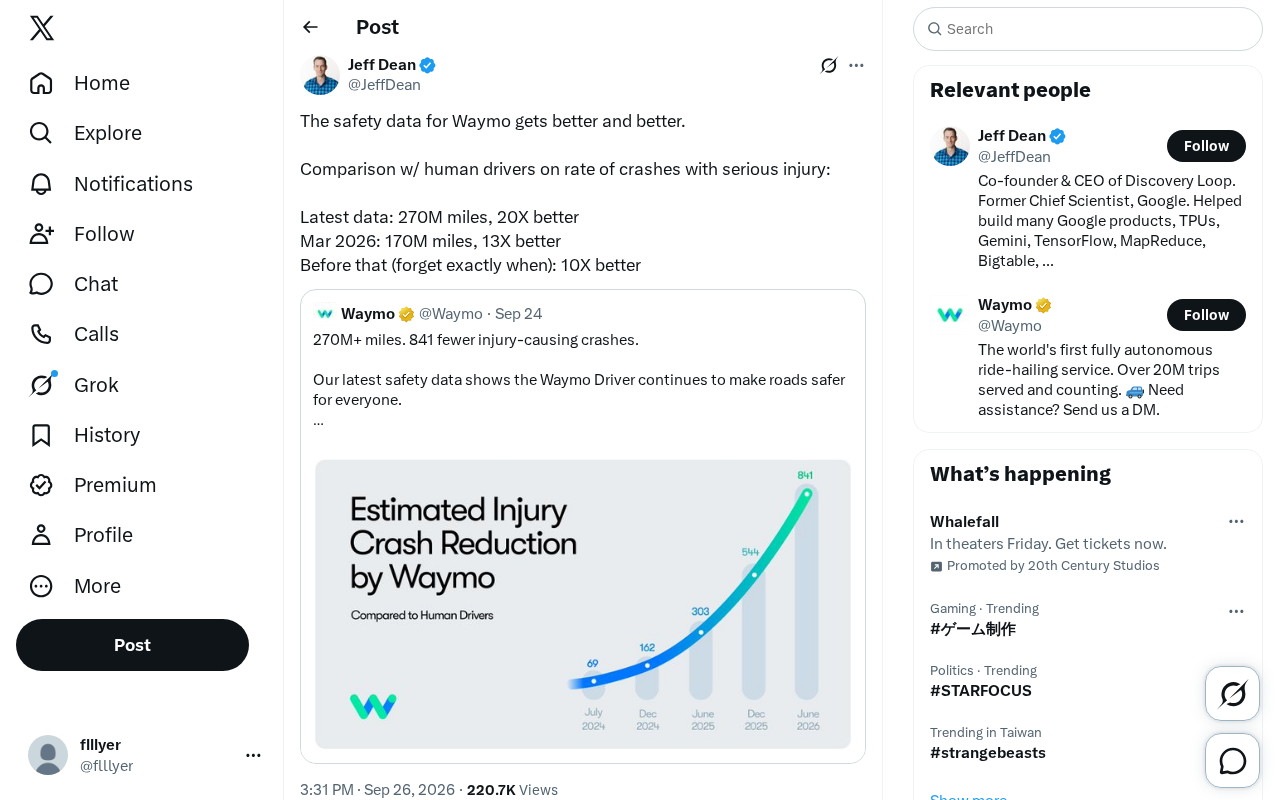
According to the latest operational statistics, Waymo's autonomous vehicles have achieved a 20x lower rate of collisions involving severe injuries compared to human drivers across 270 million miles of real-world road driving. This figure was not achieved overnight — it shows a clear improvement trajectory as mileage accumulates.
Looking back at earlier data points: at the 170 million mile mark, Waymo's safety advantage was 13x; before that, the multiple was around 10x. From 10x to 13x to 20x, each additional ~100 million miles of real operational mileage represents a step up in safety performance.
This continuous improvement is no accident. More mileage means more long-tail scenarios are covered, more edge cases enter the training data, and the model's ability to handle complex traffic interactions strengthens accordingly. In other words, Waymo's safety data itself constitutes a flywheel: the more it drives, the stronger the model, the lower the accident rate — which in turn supports even larger-scale operations.
Why "Severe Injury Crash Rate" Is the Key Metric
When discussing autonomous driving safety, different statistical methodologies lead to vastly different conclusions. Total accident rate, disengagement counts, collisions per thousand miles... these metrics each have their value, but the "severe injury crash rate" carries particularly significant weight.
The reason is that minor fender-benders and severe casualties are worlds apart in terms of social cost, legal consequences, and public perception. If autonomous driving merely shifted minor accidents into more severe ones, the technology's social value would be greatly diminished. Waymo's choice to use severe injury crash rate as its core external metric essentially anchors its safety narrative to the most persuasive dimension.
A 20x gap means: over the same driving distance, a human driver's probability of causing severe injury is 20 times that of Waymo. A difference of this magnitude already exceeds the range of statistical noise, pointing to a systemic safety advantage.
Statistical Noise and Confidence. Statistical noise refers to data fluctuations caused by randomness that do not reflect a true trend. When evaluating autonomous driving safety, if the accident sample itself is very small, results under different statistical methodologies can vary dramatically due to chance factors, making it difficult to support reliable conclusions. The significance of the 270 million miles and 20x gap that Waymo emphasizes lies in pushing the sample size to the hundred-million level, enabling even low-frequency events like severe injury crashes to form relatively stable comparisons. The larger the mileage base, the smaller the impact of random fluctuations on results, and the more likely the 20x magnitude points to a systemic safety advantage rather than short-term coincidence. This is also the fundamental reason why "mileage equals evidence" in autonomous driving safety arguments.
The Technical Logic Behind the Data Improvement
The leap from 10x to 20x corresponds to a period of continuous technological iteration. Several key factors deserve attention:
Continuous optimization of sensors and perception capabilities. The fusion approach of LiDAR, cameras, and millimeter-wave radar has steadily improved performance in adverse weather, nighttime, and complex lighting conditions, reducing risks caused by perception blind spots.
Closed loop between simulation and real-world data. Waymo's long-term investment in large-scale simulation testing enables it to repeatedly train responses to rare scenarios without increasing actual road risk. Edge cases encountered in real operations are quickly fed back into the simulation environment, forming an iterative closed loop.
Cautious expansion of operational boundaries. Improvements in safety data may also partly come from optimized operational design — accumulating mileage in more controllable areas and gradually expanding into complex scenarios. This is a pragmatic strategy: first prove safety with data, then exchange it for greater operational space.
Long-Tail Scenarios and Edge Cases. Long-tail scenarios refer to rare situations that occur with extremely low frequency in real traffic but are extremely diverse in type — such as unconventional road construction layouts, animals suddenly crossing, abnormal driving behavior by other vehicles, etc. Edge cases are samples within long-tail scenarios that are especially close to the system's capability boundary and prone to triggering misjudgments or failures. Although their individual probability of occurrence is very small, they are often highly correlated with severe accidents. In early mileage, autonomous driving systems can hardly encounter enough of these samples, so the model's coverage of them is insufficient; only as real operational mileage continues to accumulate do these rare scenarios get repeatedly collected, annotated, and fed back into training and simulation pipelines. This is one of the important reasons why Waymo's safety advantage could improve from 10x to 20x: mileage growth not only validates the system but also continuously fills in the long-tail and edge cases that determine the safety ceiling.
Reference Significance for the Industry
Waymo's data provides a benchmark that the entire autonomous driving industry can reference. For a long time, public trust in autonomous driving was built on "technological promises," and Waymo is attempting to replace promises with "operational evidence."
Of course, the 20x safety advantage still needs to be examined in specific contexts: factors such as road complexity in operational areas, weather conditions, and time-of-day distribution all affect data comparability. But regardless, as the mileage base crosses the hundred-million mark, Waymo's safety argument is becoming increasingly difficult to simply question.
For other autonomous driving players, Waymo's path demonstrates one thing: there are no shortcuts to accumulating safety data — only sufficient real operational mileage can support a convincing safety narrative.
One-line Summary
Waymo's severe injury crash rate is 20x lower than humans across 270 million miles, continuously improving with mileage.
Paragraph Summary
Waymo's latest operational data shows that its autonomous vehicles achieved a 20x lower rate of severe injury collisions compared to human drivers across 270 million miles of real-world driving. This safety advantage was not achieved overnight but improved from roughly 10x in early stages to 13x at 170 million miles. The article argues that mileage growth brings more long-tail scenarios and edge cases into the training and simulation loop, forming a flywheel of "more driving, stronger model, lower accident rate." The choice of severe injury crash rate as the core metric is because it directly relates to social cost, legal consequences, and public trust. Sensor optimization, simulation-real data closed loops, and cautious expansion of operational boundaries together support the leap in safety performance. Waymo replaces technological promises with operational evidence, providing a reference safety benchmark for the industry, though data still needs to be examined in light of operational areas, weather, and time-of-day factors.
Related articles

"Black October": Did AI Uncover 3% of All Critical Vulnerabilities Ever?
A Reddit post claims 3% of all critical software vulnerabilities ever were found in the past month, dubbed 'Black October.' We break down the statistical issues, how AI-assisted code auditing accelerates discovery, and how developers should respond.

Microsoft Project Gecko: Using AI to Bridge Language Gaps for African Farmers
Microsoft's Project Gecko launches PharmaChat, letting African farmers ask questions in their native language and get precise video clips and farming book chapters via AI. The project also releases three interactive manuals to advance inclusive AI.

Musk's Space Dominance: How Starlink Throttling Undermines Ukraine's Defense
SpaceX's Starshield throttling disabled Ukraine's high-speed interceptor drones, exposing how Musk's private control over low Earth orbit communications affects battlefield dynamics and national security, and highlighting the risks of commercial space militarization and space governance dilemmas.