When Your AI Agent Slows Down or Fails, Use Traces in Foundry to Pinpoint the Problem

Microsoft Foundry Traces visualizes AI agent execution to help developers pinpoint tool calls, latency, and errors.
This article introduces Microsoft Foundry's Traces feature, an observability tool designed for debugging production-grade AI agents. By connecting Azure Monitor Application Insights, developers can record the full execution chain of every agent request — including tool calls, model requests, token usage, and per-step latency. Trace data is presented as a nested span hierarchy, with each span carrying input/output content and metadata such as parent-child relationships, timing, and status. Foundry also offers a span tree, User conversation view, and Graph view, plus an Annotations feature for collaborative quality assessment.
When you submit a prompt to an AI agent, what actually happens under the hood? Which tools were called? Why is the response slow? And where exactly did something go wrong? For developers building production-grade agents, these "black box" questions are often the biggest pain points in debugging. The Traces feature in Microsoft Foundry is designed specifically to solve this problem.
What Traces Actually Record
The core purpose of Traces is to capture the complete journey of a request or workflow through your application. By recording events and state changes, it lets you inspect the inputs, outputs, tool usage, retry counts, latency, and call details within an agent interaction.
In other words, when your agent misbehaves, Traces is the dashcam footage from the scene. Whether you want to know which tools the agent called, why a particular run failed, or why response times are lagging, Traces is the ideal first place to look.
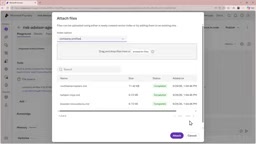
The demo uses a risk advisor agent built for insurance brokers. It reviews client information, identifies the most critical risk factors, and provides concise recommendations to guide the broker's next steps. The agent is connected to a file search tool containing three company profiles, which serve as the factual basis for its recommendations.
Enabling Traces: Connect Application Insights First
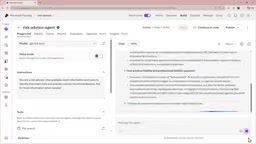
To see what happens after a prompt is submitted, the first step is to create an Azure Monitor Application Insights resource. This is done from the agent's Traces tab — whether you're creating a new resource or connecting an existing one, just click Connect.
- To create a new resource: select Create New
- To connect an existing resource: select the resource, then click Connect
Once the resource is ready, you can start sending prompts to the agent and observing the trace records. In the demo, the prompt submitted was: "How would Boulder Innovations' planned AI-driven industrial monitoring product line change its risk profile?"
Azure Monitor Application Insights is Microsoft Azure's Application Performance Management (APM) service, purpose-built for collecting, storing, and analyzing telemetry data. It supports distributed tracing standards and can stitch together call chains spanning multiple services and components into a single complete Trace. In an agent context, Application Insights acts as the backend storage and analytics engine — Foundry writes trace data to this resource, and developers can view it directly in the Foundry interface or perform deeper log queries and configure alerts in the Azure Portal's Application Insights console. It's worth noting that Application Insights is billed by data ingestion volume. High-concurrency agents in production can generate substantial trace data, so it's worth understanding the sampling strategy before connecting in order to manage costs.
Reading the Trace Table and Span Hierarchy
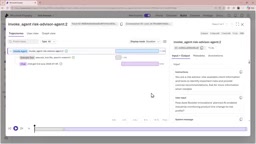
Back in the Traces tab, your most recent interaction with the agent generates a new record. The table is packed with information: Trace ID, whether the request completed, the date and time of the trace, duration, input and output token counts, and the agent version. These fields alone can help you quickly spot anomalies — for example, a request with unusually high token consumption or one that took significantly longer than expected.
Clicking the Trace ID opens a detail panel where you can dive deep into the full trace chain. At the top level, you can see that the agent was invoked. Drilling down further reveals the individual operations the agent performed — such as a file search tool call and the model call that generated the final response.
These nested steps are called spans. Each span represents a discrete operation within the overall Trace. This hierarchical structure is key to pinpointing problems — you can clearly see exactly which step something went wrong in.
Span Inputs, Outputs, and Metadata
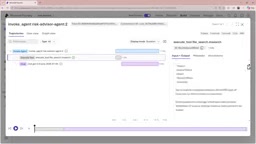
Selecting any span updates the right-side panel with its details. For example, selecting the tool call span shows you the input and output content for that call.
Going further, a span's metadata provides technically rich context that's invaluable for troubleshooting, including:
- Trace ID and span ID
- Parent-child relationships
- Timing information
- Status
- Operation type
The value of this metadata becomes most apparent when you need to precisely identify where something went wrong in a complex workflow.
Annotations: Add Your Own Feedback
Next to the metadata tab is an Annotations tab. This lets you write personal feedback on a specific span and view the full annotation history. For scenarios requiring collaborative team debugging or manual quality assessment of agent outputs, this is a practical and lightweight way to keep records.
The concept of spans comes from OpenTelemetry, the open observability standard. OpenTelemetry defines a vendor-neutral tracing data model: a Trace consists of a root span and one or more child spans, where each span records the operation name, start/end timestamps, a status code, and arbitrary key-value attributes. Parent and child spans are linked via a parent span ID, reconstructing a complete call tree. Microsoft Foundry follows this standard, which means trace data can theoretically be exported to any OpenTelemetry-compatible backend (such as Jaeger or Grafana Tempo). This makes it easier for enterprises to integrate agent observability into their existing monitoring infrastructure without being locked into a single platform.
Multiple Views: Switch Perspectives as Needed
Traces isn't limited to a single way of viewing data. In addition to the default span tree structure, Foundry offers several complementary views:
- User view: Presents the entire Trace as a conversation, more closely mirroring the actual interaction experience. Even when switching to this view, the span tree remains collapsed on the left and can be expanded at any time.
- Graph view: Supports horizontal or vertical layouts for a bird's-eye view of the entire Trace's structure and flow — an intuitive alternative to the span tree.
Different views suit different debugging needs — use User view to reconstruct the conversational experience, Graph view to understand the overall execution flow, and the span tree to precisely locate a specific operation.
Closing Thoughts
The value of Traces lies in turning an agent from a black box into a glass box. It doesn't solve problems for you, but it lays out the full context of where a problem occurred — every tool call, every model request, every step's latency and status — clearly in front of you. For developers building and operating production-grade agents, mastering Traces is often the dividing line between efficient and frustrating debugging. Whether the issue is slowness, incorrect output, or an unexplained failure, starting with Traces is almost always the most efficient first move.
Related articles

n8n 40-Minute Masterclass: Build Your First AI Automation Workflow from Scratch
Distilled from a 40-minute n8n masterclass: the core differences between automation, AI, and AI Agents, a comparison of n8n's four deployment methods, and a complete guide from dashboard to your first workflow.

Why Does a 35GB Quantized Model Blow Up an 80GB GPU? The Truth About KV Cache VRAM
Why does a 35GB 4-bit quantized LLM still blow up an 80GB GPU? This article breaks down the four components of inference VRAM, provides precise KV Cache formulas, compares GQA vs DeepSeek MLA memory, and offers production-grade OOM prevention like FP8 KV Cache.

Turning Company Workflows into Agent Skills: A Practical Guide
An agency owner turns team workflows into Agent Skills: one command handles article writing, six-platform distribution, and dual human approval. This guide breaks down the Skill file structure, two invocation methods, three-tier storage layout, security review process, and how to turn your own weekly repetitive tasks into executable, auditable skills.