Self-Hosted Access Log Analysis: A Selection Guide for Loki vs ELK vs GoAccess

A practical comparison of Loki, ELK/OpenSearch, and GoAccess for self-hosted access log analysis.
This guide compares three major self-hosted access log analysis solutions — Grafana Loki, ELK/OpenSearch, and GoAccess — across dimensions including resource consumption, feature depth, and integration capabilities. It helps operations teams choose the right tool based on their existing tech stack, data scale, and operational capacity to build a complete traffic observability system.
From Infrastructure Monitoring to Application Traffic Insights
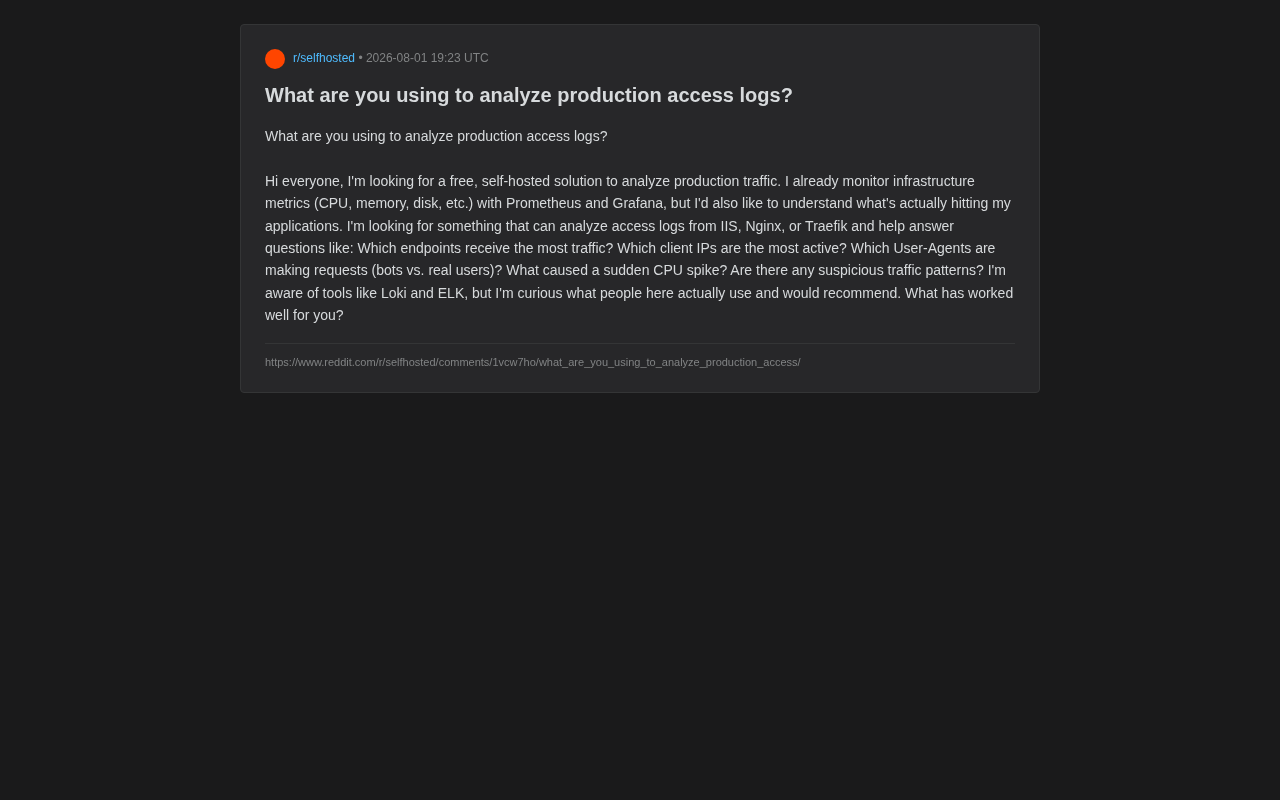
In production observability practices, many operations teams face a typical advanced requirement: infrastructure metrics are well-monitored, but the actual application-layer traffic remains a "black box." Recently, a developer on the Reddit community raised a highly representative question — they had already set up monitoring for CPU, memory, disk, and other infrastructure metrics using Prometheus and Grafana, but still wanted to figure out "what exactly is accessing my application."
Behind this question lies a commonly overlooked layer in monitoring systems: Access Log Analysis. Infrastructure metrics can tell you "system load is high," but only access logs can answer "why" — whether a crawler is aggressively scanning, a hot endpoint is being called excessively, or the system is under an abnormal traffic attack.
From a broader perspective, modern Observability is typically divided into three pillars: Metrics, Logs, and Traces. Metrics are aggregated numerical time-series data, suitable for alerting and trend analysis; Logs are discrete event records containing the richest contextual information; Traces record the call paths of requests across multiple services. Prometheus focuses on metrics collection and doesn't natively handle log text, so when operations teams need to answer questions like "who is accessing, what are they accessing, and why is it abnormal," they must introduce a dedicated log analysis system to complete the observability puzzle.
Core Questions Access Log Analysis Needs to Answer
The developer explicitly listed several categories of key questions they hoped an access log analysis tool could answer, which actually represent common needs across most production environments:
- Which endpoints have the highest traffic? Used to identify hot paths and guide caching and optimization strategies.
- Which client IPs are most active? Used to discover abnormal callers or potential abuse.
- Which User-Agents are making requests (bots vs. real users)? Used to distinguish crawlers, scanners, and real user traffic.
- What's causing sudden CPU spikes? Correlating application traffic with infrastructure metrics.
- Are there suspicious traffic patterns? Used for early detection of security threats.
The common thread among these questions is: they all require aggregation, filtering, and time-series analysis of structured or semi-structured log text — precisely what Prometheus and other numeric-metric-centric monitoring systems are not designed for.
It's worth elaborating on the difference between "structured" and "semi-structured" logs. Structured logs are output in formats like JSON, where each field has explicit key-value pairs, making them easy for machines to parse and index. Semi-structured logs, like traditional Nginx access logs, have a fixed format but are not strictly key-value structured, requiring grok patterns or regular expressions for parsing. In modern practice, more teams tend to output JSON-formatted logs directly at the application layer, allowing any tool — whether Loki, ELK, or others — to skip complex parsing steps and directly extract fields for aggregation analysis, significantly improving the reliability and performance of the log processing pipeline. Therefore, introducing a dedicated log analysis stack becomes an inevitable choice.
Comparison of Mainstream Self-Hosted Solutions
The questioner specifically emphasized two constraints: free and self-hosted. Under these premises, several solutions that repeatedly appeared in community discussions deserve individual analysis.
Grafana Loki: Seamless Integration with Existing Monitoring Stacks
For teams already using Grafana, Loki is almost the most natural choice. Developed by Grafana Labs, it positions itself as "a log system like Prometheus" — it doesn't build full-text indexes on logs but only indexes metadata labels, making its storage cost far lower than full-text indexing solutions.
Specifically, Loki employs a unique "label indexing + compressed log chunk storage" architecture inspired by Prometheus's label model. Unlike Elasticsearch, which builds an inverted index for every word in every log entry, Loki only indexes stream labels (such as job, namespace, filename), while log content is stored as compressed chunks in object storage (like S3, MinIO) or local filesystems. During queries, it first locates target log streams via labels, then performs content matching within those streams. This design dramatically reduces write costs and storage space — officially claimed to be an order of magnitude cheaper than ELK.
Loki's greatest advantage lies in its deep integration with the existing Prometheus + Grafana ecosystem. You can display CPU spike curves alongside access logs from the corresponding time period on the same Grafana dashboard, enabling quick correlation between "metric anomalies" and "log evidence." For requirements like "what caused the CPU spike," this metric-log linkage capability is particularly crucial.
Its companion components are typically Promtail or Alloy (responsible for log collection), paired with the LogQL query language for filtering and aggregation. Promtail is Grafana's official log collection agent designed for Loki, similar to Filebeat for Elasticsearch, collecting logs by watching file paths, Kubernetes Pod logs, or systemd journals, then adding labels to log streams based on configuration before pushing to Loki. Grafana Alloy (formerly Grafana Agent's Flow mode) is Grafana's new unified telemetry collector that can simultaneously handle metrics, logs, and trace data, reducing the operational burden of deploying multiple agents. For teams already in the Grafana ecosystem, Alloy is gradually becoming the recommended unified collection entry point.
LogQL is Loki's query language, with syntax highly similar to PromQL, supporting label filtering, regex matching, line filtering, and aggregation functions (such as rate, count_over_time, topk), making it suitable for log volume trends and pattern analysis. The downside is that LogQL's full-text search capabilities are relatively limited — it's less flexible than Elasticsearch's Query DSL for free-text search, making it less convenient for complex retrieval scenarios compared to ELK.
ELK / OpenSearch: Powerful but Resource-Intensive
ELK (Elasticsearch + Logstash + Kibana) is the classic solution in the log analysis domain. Its core advantage is powerful full-text search and flexible aggregation analysis. Through Kibana's visualization interface, you can easily build charts for endpoint traffic rankings, IP activity, User-Agent distribution, and more, covering virtually all the aforementioned analysis needs.
Elasticsearch's powerful capabilities stem from its underlying Apache Lucene engine and Inverted Index mechanism — building mappings for every term in documents, enabling full-text searches to complete in milliseconds. However, this indexing approach also consumes far more write and storage resources than label-only indexing solutions: each log entry requires tokenization, indexing, and segment file writing during ingestion, with JVM heap memory requirements typically starting at 4-8GB minimum, and index data itself occupying several times the disk space of raw logs. For high log volume scenarios, you also need to consider sharding strategies, replica counts, hot-warm-cold data tiering, and other operational details.
Since Elasticsearch subsequently changed its license (from Apache 2.0 to SSPL and Elastic License in 2021), the community also widely recommends using its fork OpenSearch (created by AWS based on the last Apache 2.0 version 7.10.2, now governed by the OpenSearch project under the Linux Foundation) to avoid licensing risks. OpenSearch is highly compatible with Elasticsearch in functionality, with continuously growing community activity, and many license-sensitive enterprises and open-source projects have already migrated to OpenSearch.
The cost of ELK is high resource consumption and operational complexity. Elasticsearch has demanding memory and disk requirements, which may feel like "using a sledgehammer to crack a nut" for small to medium-scale applications. If you're only analyzing access logs from a single Nginx/IIS instance, the operational burden of a full ELK stack may outweigh its benefits.
GoAccess: A Lightweight Instant Analysis Tool
Beyond the two "heavyweight" solutions above, the community also frequently recommends lightweight tools like GoAccess. It's an open-source real-time web log analyzer that can directly parse access logs in Nginx, Apache, and other formats, instantly displaying statistics on endpoint traffic, IPs, User-Agents, status codes, and more in the terminal or generated HTML reports.
GoAccess is written in C and compiled into a single binary. It parses predefined or custom log format strings (supporting Combined Log Format, custom Nginx log_format, etc.) and builds hash tables in memory to compute statistics across various dimensions. It supports real-time mode (pushing updates to browsers via WebSocket) and batch mode (one-time parsing to generate static HTML reports). Since it doesn't depend on external databases, a single ordinary server can process hundreds of thousands of log lines per second.
For scenarios where you need a "quick glance at traffic distribution," GoAccess requires virtually zero configuration and works out of the box, making it ideal as a lightweight supplement or transitional solution. Its limitation is that all data resides in memory — it lacks persistence capabilities, long-term storage, and complex cross-time-period querying, making it suitable for instant diagnostics rather than long-term trend analysis.
Selection Recommendations: Start from Actual Needs
Overall, selection should revolve around three dimensions: existing technology stack, data scale, and operational capabilities:
| Solution | Applicable Scenarios | Core Advantages | Main Limitations |
|---|---|---|---|
| Grafana Loki | Existing Grafana ecosystem | Metric-log linkage, low resource usage | Limited full-text search capabilities |
| ELK / OpenSearch | Deep analysis and complex search needs | Comprehensive features, powerful visualization | High resource consumption, high operational cost |
| GoAccess | Quick overview, lightweight deployment | Zero-config ready to use, extremely low resources | No long-term storage, weak query capabilities |
Specific recommendations:
- Already have a Grafana ecosystem → Prioritize Loki. It maximizes reuse of existing dashboards, enables unified observation of metrics and logs, and has manageable resource usage.
- Need strong search and deep analysis → Choose ELK / OpenSearch. When log analysis becomes core work requiring frequent complex queries and data mining, its capabilities justify the investment.
- Only need a quick overview → GoAccess is the ideal lightweight starting point, with the option to upgrade to either of the above as needed.
For scenarios already running Prometheus + Grafana, Loki is undoubtedly the choice with the highest return on investment — it can satisfy analysis needs across dimensions like endpoint traffic, IPs, and User-Agents, while directly pinpointing the traffic root cause behind CPU spikes through temporal alignment with metrics.
Conclusion
Access log analysis is the critical step in observability's journey from "monitoring systems" to "understanding business." Infrastructure metrics tell you "how the system is doing," while access logs tell you "why it's that way." Under self-hosted and free constraints, Loki, ELK/OpenSearch, and GoAccess form a complete spectrum of solutions from light to heavy. The true best practice often isn't about choosing the "most powerful" tool, but rather choosing the solution that best matches your team's existing capabilities and actual needs.
Related articles

Top University Machine Learning Course Notes Collection: Free and More Practical Than Textbooks
Curated collection of free ML course notes from MIT, Harvard, Stanford & more. These professor-written notes rival textbooks in depth, with strict inclusion criteria and open-source collaboration.

White House Invites OpenAI and Other Giants to Preview Voluntary AI Framework: Open-Source Language Becomes Key Battleground
Trump administration invites OpenAI, Anthropic, and Google to preview a voluntary AI framework, with open-source language emerging as the core lobbying battleground that could reshape industry competition.

AI Art Prompt Structure Breakdown: Creating a Desert Crystal Pyramid Scene
Breaking down a popular Reddit AI artwork to reveal the five core elements of structured prompts: subject, material, lighting, environment, and atmosphere for AI art scene creation.