28.7% Win Rate but $58K Profit? Three Traps in Quantitative Strategy Evaluation
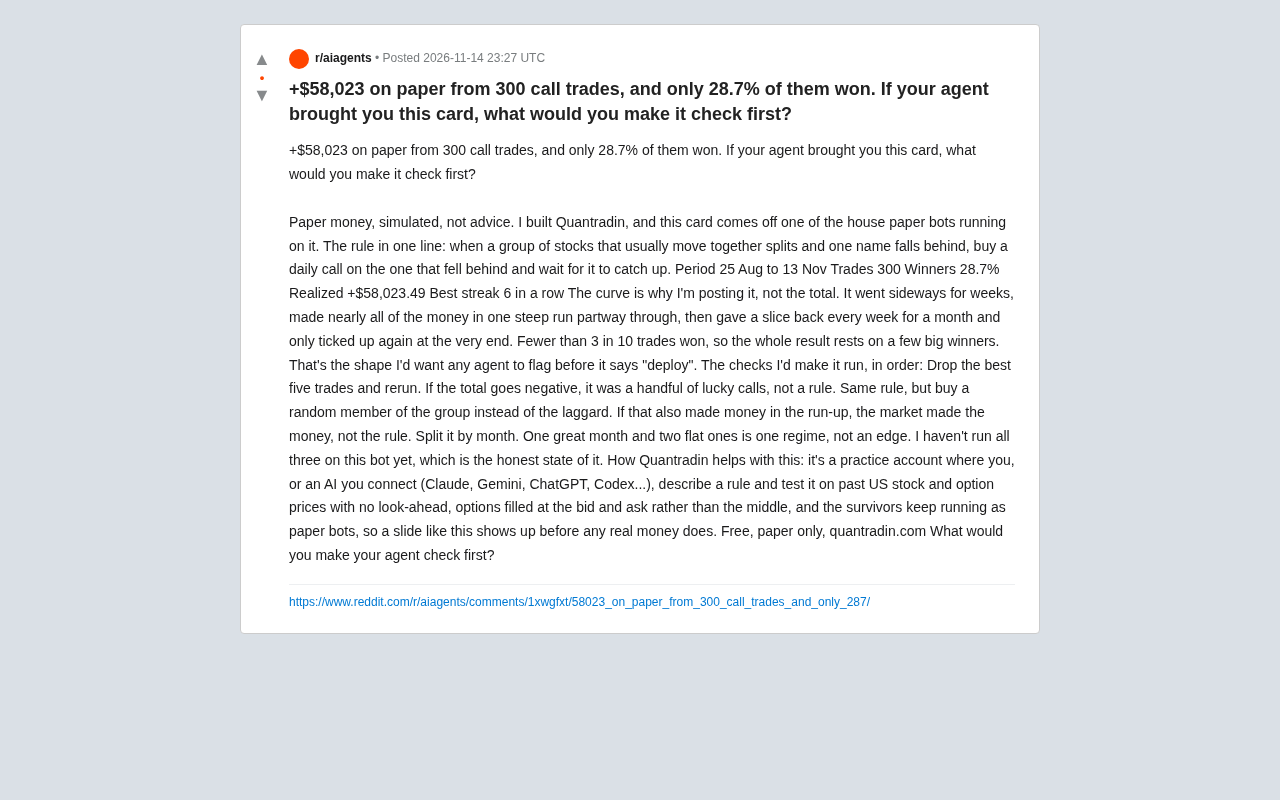
28.7% win rate, $58K profit — returns hinge on a few big winners and need counterfactual checks.
A developer shared a 300-trade call option scorecard with only a 28.7% win rate yet $58,023.49 in profit. The equity curve — flat for weeks, then a steep climb, then weekly givebacks — exposes the strategy's dependence on a few large winners. The article proposes three checks AI agents should run first: re-run after removing the best five trades, replace the lagging stock with random group members as a control, and break down results by month — to determine whether returns come from repeatable rules rather than luck or market beta. It also stresses that backtests need no look-ahead bias and bid/ask fills rather than midpoint, otherwise returns are systematically overstated. The core conclusion: agents evaluating strategies should actively design counterfactual tests and deconstruct the structure behind the numbers, not just recite total returns — a principle that applies to marketing, product experiments, and beyond.
A developer shared his simulated trading scorecard: 300 call option trades with a win rate of only 28.7%, yet generating $58,023.49 in profit. The equity curve sparked discussion — it didn't trend upward steadily, but rather plateaued for weeks before suddenly steepening, then gave back a portion of profits each week for a month, only to recover slightly at the end. This shape precisely exposes the typical traps in quantitative strategy evaluation. If an AI agent handed you a card like this, what should it check first?
Low win rate doesn't mean a bad strategy, but high returns may just be luck
The strategy's rules are simple: when a group of stocks that typically move together diverges and one lags behind, buy daily call options on the lagging stock and wait for it to catch up. Fewer than 30% of the 300 trades won, meaning the entire result depends on a handful of large gains.
This isn't to dismiss the strategy itself, but to remind: total returns alone cannot distinguish "effective rules" from "a few lucky bets". The developer himself admits that the shape of the curve — not the total amount — is what prompted him to post.
Three checks an agent should run first
The developer listed the checks he expects any agent to perform in order before saying "ready to deploy":
1. Re-run after removing the best five trades
If total returns turn negative after removal, the profit comes from a few lucky trades rather than a repeatable rule. This is the most direct test of strategy robustness.
Why "removing the best five" is the first threshold for robustness
In strategies with highly skewed return distributions, total returns are extremely sensitive to a tiny number of samples. Quantitative research commonly uses "return concentration" to measure this: sort each trade's P&L in descending order and observe what proportion of total profit the top 1%–5% of trades contribute. If this proportion approaches or exceeds 100%, it means removing them immediately turns the strategy negative — the rule itself doesn't generate positive expectancy, it merely captured a few favorable tail events.
Complementary metrics include "trimmed mean" and "median P&L" — they resist outliers better than the mean. A practical criterion is: after removing the best N trades, returns remain positive and the P&L distribution of remaining trades shows no obvious degradation. Statistically, this corresponds to a preliminary screening for out-of-sample stability. While it can't prove a strategy is effective, it can cheaply eliminate "luck-based" candidates.
2. Replace the lagging stock with a random group member
Same rules, but buy a randomly chosen stock from the group instead of the lagging one. If random selection also makes money in an uptrend, then what's making money is the market conditions, not the rule itself.
Distinguishing random controls from market beta
The essence of this test is constructing a "placebo group": keep entry timing, holding period, and position sizing rules unchanged, replace only the stock selection logic with random choice, and observe whether returns persist. If the random group also profits, the source of returns is overall market appreciation (i.e., beta), not the selection rule (i.e., alpha).
Statistically, this amounts to a null hypothesis test — assuming the rule has no predictive power, random selection results should be distributed identically to rule-based selection results. A rigorous approach is to repeat randomization hundreds of times to obtain a return distribution range, then check whether the original strategy's returns fall significantly outside that distribution. A single random substitution has limited persuasive power because individual random results are themselves highly variable. For strategies relying on mean-reversion logic like "lagging stocks catching up," random controls are especially critical, because in an uptrend almost any asset will rise, making it easy to mistake market conditions for rule effectiveness.
3. Break down results by month
One strong month, two flat months — this indicates a chance result under a single market regime rather than a persistent edge.
The developer candidly admits he hasn't yet run all three checks on this bot — an honest status disclosure that also highlights the self-deception risk common in quantitative backtesting.
Backtest environment details determine credibility
The developer described Quantradin's design philosophy: it's a practice account where users or connected AIs (Claude, Gemini, ChatGPT, Codex, etc.) can describe rules and test them against historical US stock and options prices. Key design choices include: no look-ahead bias, options filled at bid/ask rather than midpoint, and surviving strategies running continuously as simulated bots.
These details directly affect backtest credibility. Midpoint fills overstate returns; look-ahead bias creates false advantages. Only strategies that still hold under these constraints deserve further attention.
What look-ahead bias and bid/ask fills actually mean
"Look-ahead bias" refers to backtests using information that wasn't available at decision time — for example, using the day's closing price to decide on a trade at the day's open, backfilling published earnings data to dates before the announcement, or mistakenly using the next period's price in signal calculations. Such errors make backtest curves unusually smooth and attractive but impossible to replicate in live trading — one of the most common backtest traps.
Fill price assumptions in options backtesting are equally critical. There's a spread between bid and ask; filling at the midpoint systematically ignores half the slippage cost. Options spreads are often much wider than the underlying stock, especially for small caps or far-month contracts — midpoint estimates significantly overstate returns and understate turnover costs. Realistic fills should assume buying at ask and selling at bid, and account for partial fills or additional market impact when liquidity is insufficient. Only strategies that still hold under these conservative assumptions are worth further validation.
Implications for AI agent evaluation capabilities
When an AI agent is asked to evaluate a trading strategy, it needs more than calculating total returns — it needs to actively design counterfactual tests. The three checks above essentially ask: Does the return depend on a few samples? Is it just market beta? Does it only work in one market regime?
These questions apply equally to strategy evaluation in other domains — marketing channels, product experiments, operational rules. An agent that can only recite numbers without deconstructing the structure behind them hasn't met the "ready to deploy" standard.
The developer ends by asking: what would you have your agent check first? This question is worth pondering for anyone using AI for decision support.
Why counterfactual testing is a core capability for agent evaluation
Counterfactual testing means: change one key condition and observe whether the conclusion still holds. What distinguishes it from simply computing metrics is that it actively constructs "what if it weren't this way" control scenarios, thereby decomposing total returns into attributable components — how much from the rule, how much from market conditions, how much from a few samples, how much from a specific market regime.
For AI agents, this requires a complete chain of proposing hypotheses, designing controls, and explaining differences — not just aggregating numbers. It also means evaluation conclusions should carry conditional qualifiers, such as "still positive after removing the best five, but not significant under random controls," rather than a simple "deployable / not deployable." Codifying this structured skepticism into evaluation workflows can significantly reduce the risk of mistaking luck for skill — a principle that applies equally to marketing channel attribution, A/B test interpretation, and similar scenarios.
Related articles

Gemini 4 Neon Review: Benchmark Scores Rival Carbon, API Pricing and Quota Breakdown
Google Gemini 4 Neon is now live, benchmark scores closely tracking Carbon, API pricing 3/15 at twice Hydrogen's rate. This article compiles Bilibili creator testing: Neon can replace 90% of Carbon scenarios, AntiGravity quota consumption is only one-third of Carbon, plus subscription channel restrictions and 2API ban risks.

Gemini 4 Helium Coming Soon? Signals of Google Loosening Subscription Restrictions
Google team member hints releases will continue; community speculates Gemini 4 Helium (Flash Lite) may be next. Subscription ban controversy gets a response as product lead says "Soon," suggesting restrictions may be lifted. This article covers Gemini developments, OpenAI Coding Agent and risk management, Doubao real-time audio-video API, and compute business dynamics.

AI-Assisted React Development in Practice: Optimizing a Video App and Handling Errors
A 14-year veteran developer demonstrates AI-assisted React video app optimization: compressing video from 80MB to 5MB (~94%) via ImageKit, plus reliable error handling and retry mechanisms. Includes planning, code understanding, and verification methods for working with AI.