A Single Denominator Caused a Data Leak: The Hidden Trap in a Quantitative Finance Paper

A quantitative paper's feature denominator leaked future data — exposing two types of data leakage and architectural fixes.
A quantitative finance paper passed peer review with a feature that used total daily volume as a denominator — inadvertently leaking future information into intraday timestamps. This article dissects the case, distinguishes generation leakage from selection leakage, explains how to establish IC baseline intuition to detect anomalies, and proposes constrained operator architectures that make future-data access structurally impossible.
Prologue: A Real-World Leak Beyond the Textbook
In machine learning courses, the data leakage examples we encounter are mostly "toy-level": leaving the target variable in the feature set, or normalizing the entire dataset before splitting. Data leakage is one of the most destructive pitfalls in machine learning — its essence is inadvertently introducing information during model training or feature engineering that would be impossible to obtain in a real prediction scenario. The most common beginner mistakes include applying StandardScaler normalization to the entire dataset before the train/test split (allowing the test set's mean and variance information to bleed into the training set), or retaining proxy variables in the feature matrix that are highly correlated with the target variable. These mistakes are easy to spot and straightforward to construct for teaching purposes. But their damage pattern is consistent: the model performs exceptionally well in offline evaluation, then suffers a cliff-like performance drop after deployment, because what the model learned wasn't genuine predictive patterns but artificial shortcuts created by the data processing pipeline.
But leakage in real-world systems is often far more subtle. A Reddit user spent an evening combing through the appendices of quantitative finance papers, specifically looking for a case that was "born from being burned by a real system and written down by the person involved." The example he ultimately found had a problem in just a single denominator — yet it was enough to corrupt the entire feature system.
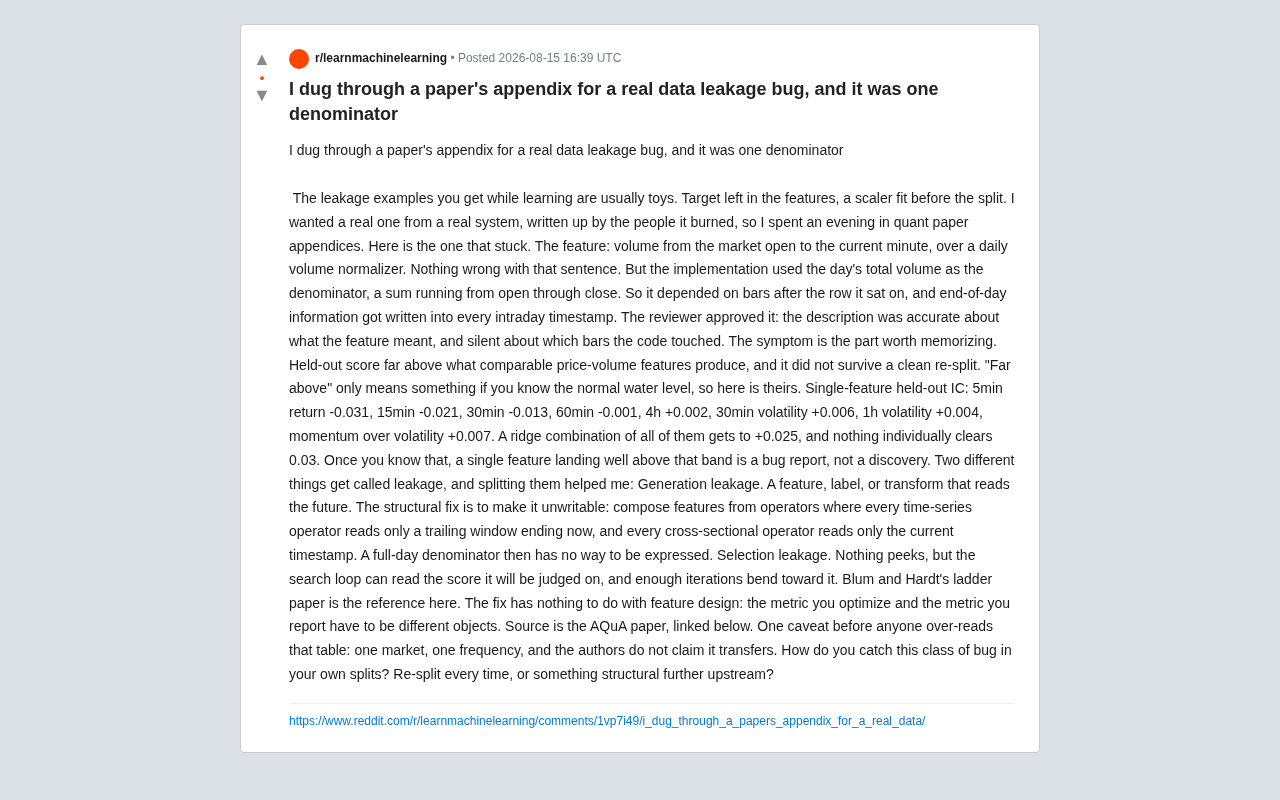
This case is worth revisiting repeatedly because it reveals a brutal truth: leakage doesn't have to come from sloppy mistakes — it can hide behind a feature description that is semantically perfectly correct.
How a Single Denominator Wrote Future Information into Features
The feature in question sounds completely innocuous: cumulative volume from market open to the current minute, divided by a daily volume normalization factor. This description is textually impeccable — it measures the relative trading activity up to the current time point.
The problem was in the implementation. The denominator used in the code was the total volume for the entire day — a sum accumulated from open all the way to close.
What does this mean? It means this feature depends on bar data that comes after the row it belongs to. In other words, information that can only be confirmed at market close was quietly written into the feature values at every intraday timestamp. Every sample at 11:00 AM was "peeking" at the closing volume at 3:00 PM.
To get a concrete sense of how severe this leakage is: suppose a stock's cumulative morning volume is 5 million shares. If the total daily volume is 10 million shares, the feature value is 0.5; but if the total daily volume is 20 million shares (say, due to a sudden positive news event causing a volume surge in the afternoon), the feature value becomes 0.25. The exact same morning price action yields different feature values solely because different events occurred in the afternoon — this is the hallmark of "future information contamination."
What's even more alarming is that peer review passed this feature. Because the textual description accurately explained what the feature "represents," while remaining silent about which bars the code "actually reads." Semantically correct, but implementation overreach — this is precisely why this class of bugs is so hard to catch.
The Symptom: IC Scores Far Above Normal Waterline
What truly deserves remembering is the symptom of this bug:
- Held-out scores were far higher than comparable price-volume features;
- After performing a clean data re-split, the high scores could not be reproduced.
But "far higher" only means something when you know what the "normal waterline" looks like. Here we need to first understand IC (Information Coefficient), the core metric for measuring predictive power in quantitative finance. IC is essentially the Spearman rank correlation (sometimes Pearson correlation) between factor predicted values and actual future returns, with a range of [-1, +1]. In real alpha factor research, a single factor with a stable IC of 0.03-0.05 is already considered outstanding — this contradicts most people's intuition, but the signal-to-noise ratio in financial markets is just that low.
To this end, the author provides the single-feature held-out IC benchmarks for their system:
| Feature | Held-out IC |
|---|---|
| 5-min returns | -0.031 |
| 15-min returns | -0.021 |
| 30-min returns | -0.013 |
| 60-min returns | -0.001 |
| 4-hour returns | +0.002 |
| 30-min volatility | +0.006 |
| 1-hour volatility | +0.004 |
| Momentum/Volatility | +0.007 |
Combining all features with Ridge Regression yields a maximum of +0.025, and no single feature breaks through 0.03. Ridge Regression is a linear regression method that adds an L2 regularization term to the ordinary least squares loss function. In multi-factor quantitative strategies, it's commonly used as a baseline factor combination method — preserving the interpretability of linear models while avoiding overfitting to noisy signals through regularization. The fact that the combined IC maxes out at +0.025 demonstrates that even with multi-factor synergy, signal gain is extremely limited, consistent with the prevailing experience of "alpha decay" in quantitative research.
Once you have this baseline in mind, the logic becomes clear: when an isolated feature's performance clearly breaks out of this range, it's more likely a bug report than a genuine discovery. This "baseline intuition" is a critical dividing line between experienced practitioners and newcomers.
Two Fundamentally Different Types of Data Leakage
What gets collectively labeled "leakage" actually encompasses at least two types, and separating them helps us prescribe the right remedy.
Generation Leakage
This is when a feature, label, or transformation reads future information. The "total daily volume denominator" above is a classic case.
The structural solution is to make this type of leakage architecturally impossible to write. The concrete approach is to compose features using a set of constrained operators —
- Each time-series operator can only read a "rolling window ending at the current point";
- Each cross-sectional operator can only read data from the current timestamp.
The core idea of this "constrained operator system" borrows from type systems and permission controls in programming languages. Specifically, time-series operators (such as rolling_mean, rolling_std) are designed to accept only a lookback window parameter, with the window's right endpoint anchored at the current moment t and the left endpoint at t-n, thereby eliminating at the API level any possibility of reading data from t+1 or beyond. Cross-sectional operators (such as rank, zscore) can only compute across assets within the same timestamp. This design resembles Row-Level Security in databases, pushing the constraint of "no peeking into the future" from the manual step of code review down to a hard restriction at the infrastructure level.
Under such an operator system, an expression like the "total daily volume denominator" that depends on future data simply cannot be constructed. This is more reliable than post-hoc manual review — because it encodes discipline into the tooling layer rather than relying on human vigilance.
Selection Leakage
The second type is more subtle: no individual step peeks into the future, but the search loop itself can read the score it will ultimately be judged on. When the number of iterations is large enough, the model unconsciously "bends" toward that score, overfitting to the held-out set.
This type of leakage is closely related to the "Multiple Comparisons Problem" and "p-hacking" in statistics. When researchers repeatedly test different model configurations or feature combinations on the same validation set, even if each individual test is legitimate, the cumulative effect of massive experimentation can cause certain configurations to "accidentally" excel on the validation set. This essentially downgrades the held-out set from an "evaluation tool" to an "implicit training set." In quantitative finance, this problem is particularly severe because financial data has an extremely low signal-to-noise ratio, and extensive backtesting itself constitutes overfitting to historical data — academia calls this phenomenon "backtest overfitting."
The solution to this class of problems has nothing to do with feature design. The key is: the metric used for optimization and the metric used for reporting must be two different objects. Specific solutions include: strict nested cross-validation, maintaining an independent final test set (used only once after all decisions are made), and Bonferroni correction for search scale. As long as evaluation and tuning share the same score, leakage will slowly seep in through the search process.
Boundary Conditions of Benchmark Numbers
Interestingly, the IC data table cited above comes from the AQuA paper, and these results are based on a single market and a single frequency only. The original authors do not claim it transfers to other scenarios.
This reminds us of a deeper issue: financial markets exhibit extremely strong non-stationarity and regime switching characteristics. A factor effective on A-share minute-level data may completely fail on US equities at the daily level; a strategy that performs excellently in low-volatility environments may produce diametrically opposite signals during market panics. This is why top quantitative firms conduct stress tests across multiple markets, multiple time periods, and multiple market regimes, rather than relying solely on a single backtest result for decision-making.
Benchmark numbers have boundary conditions and cannot be taken out of context as universal truths. This honesty about the boundaries of one's own conclusions is precisely the quality that is scarce in both quantitative research and AI research.
Practical Principles for Preventing Data Leakage
From this case, we can distill at least two practical principles:
First, develop baseline intuition. Know the expected performance range for normal features, so that abnormally high scores trigger your alarm rather than making you think you've struck gold. In quantitative finance, this means knowing that single-factor IC typically falls within ±0.03; in computer vision, this means knowing roughly what SOTA accuracy looks like on a specific dataset. Researchers without baseline intuition are the most likely victims of data leakage.
Second, use architecture to eliminate errors rather than relying on review. Manual review can be fooled by "semantically correct" descriptions, but an operator system that only allows reading rolling windows can fundamentally leave future information with nowhere to be written. This principle applies far beyond quantitative finance — in any ML system involving time-series prediction (including demand forecasting, equipment failure prediction, user behavior modeling, etc.), similar "temporal barrier" mechanisms should be established at the data pipeline level, ensuring that feature generation code is architecturally incapable of accessing future data.
Data leakage is never exclusive to beginners. When it hides in a denominator, a summation range, or a search loop, even peer-reviewed papers can fall victim. The true defense is upgrading discipline from "human conscientiousness" to "systemic constraints."
Related articles

Gemini 4 Argon Hands-On: AI Builds Board Games, Constructs Temples, and Trains Robots Autonomously
Gemini 4 Argon hands-on roundup: AI autonomously builds a desk racetrack and temple in Blender, writes a ray tracing engine, trains a humanoid robot to sink 7 shots, plus API pricing and developer access.

The Magic Octagonal Coin: Why Only 9% of People Can Predict Its Flip?
Only 9% of people can correctly predict the Magic Octagon coin flip. This article explains its spatial rotation mechanism, common cognitive pitfalls, and a new hypothesis based on Relevance Theory, exploring the limits of human spatial reasoning.

Sam Altman: AI Is Entering the Era of Scientific Discovery — Math Breakthroughs Will Replicate in Biology and Energy
Sam Altman says AI is entering the era of scientific discovery — math breakthroughs will replicate in biology, materials science, and energy to help develop new drugs and energy sources.