Agent Observability: Why Traditional Monitoring Falls Short and Practical Solutions

Why traditional ML monitoring fails for agents, and how to build observability that actually works.
Traditional model monitoring metrics like latency, drift, and accuracy break down when AI agents make chained decisions across multiple tool calls. This article explores the unique challenges of agent observability, compares tooling options (LangFuse, LangSmith, OpenTelemetry), and offers practical guidance on building trace-centric, evaluation-driven observability systems for production agent deployments.
The Observability Challenge in the Age of Agents
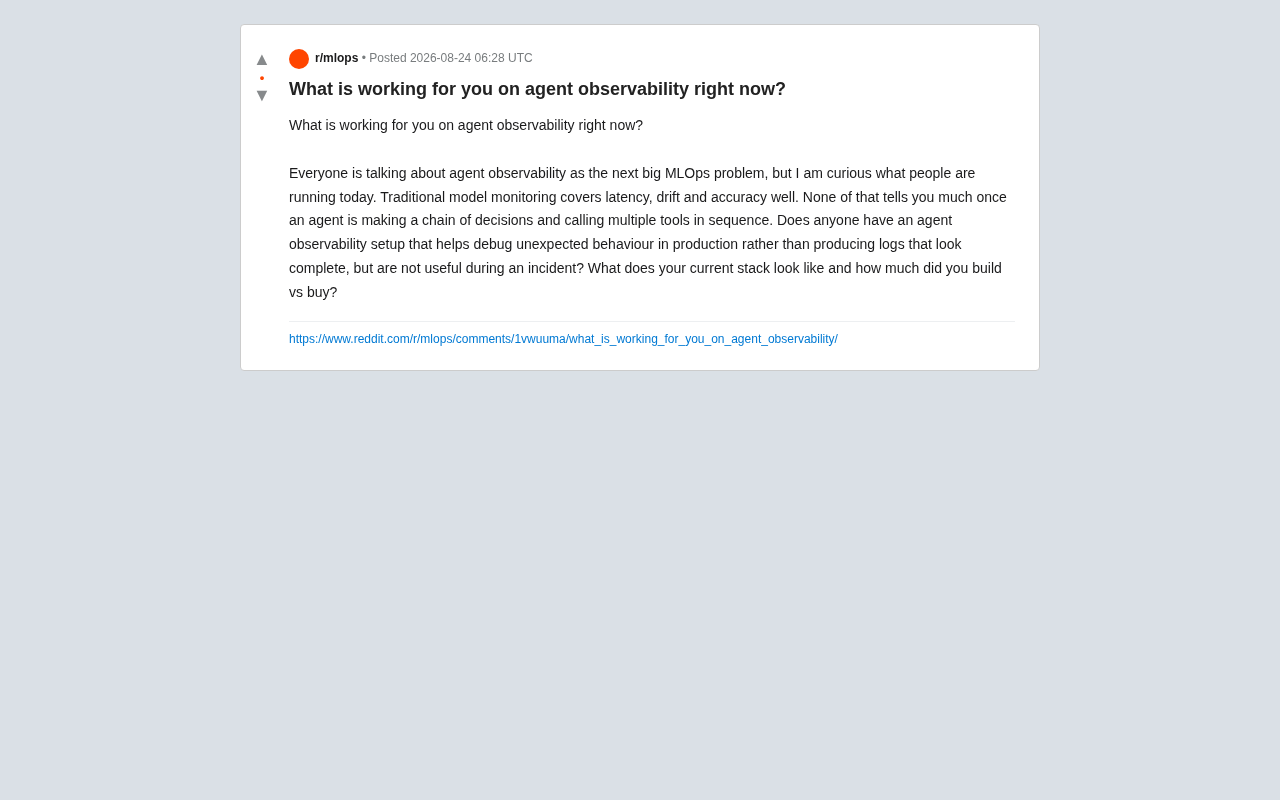
In Reddit's MLOps community, an engineer posed a question that struck a chord: "What tools are actually working for you on agent observability right now?"
This question hits at the core pain point of AI engineering. While everyone is talking about Agent Observability being "the next big MLOps problem," real-world production implementations remain scarce. The original poster put it bluntly: traditional model monitoring handles latency, drift, and accuracy just fine, but once an agent starts making a chain of decisions and calling multiple tools in sequence, those metrics tell you almost nothing.
This article examines the unique challenges of agent observability, the current landscape of tooling options, and the trade-offs between building and buying.
Why Traditional Monitoring Fails in Agent Scenarios
From Single-Point Predictions to Decision Chains
The monitoring logic for traditional machine learning models is straightforward: a request comes in, the model returns a prediction, and you monitor latency, detect feature drift, and evaluate accuracy. It's a single-point, stateless process. Traditional monitoring systems (like the Prometheus + Grafana stack) are built around three categories of metrics: Latency measures model inference time; Feature Drift / Data Drift detects whether input data distributions have shifted from the training set; and Accuracy, Precision, Recall, etc. evaluate prediction quality. This entire system rests on an implicit assumption — that the model is a stateless function mapping, producing deterministic output for a given input.
Agents operate under a fundamentally different paradigm. Their behavior is closer to a finite state machine or even a Turing machine, where a single execution may involve dozens of state transition nodes, each node's output depending on the accumulated context from preceding nodes. A single task execution often includes:
- Multiple rounds of LLM inference, each potentially altering the subsequent trajectory
- Sequential or parallel calls to multiple external tools (APIs, databases, search engines)
- Dynamic adjustment of decision paths based on intermediate results
- Self-reflection, retry, and error-correction loops
Even if each individual LLM call has normal latency and the output "looks reasonable," the entire decision chain can still go off the rails at some point. The traditional trio of latency, drift, and accuracy metrics cannot capture this type of cascading failure mode. This makes the traditional single-point monitoring paradigm fundamentally unsuitable for agent scenarios.
Logs That "Look Complete but Are Utterly Useless"
The original poster's sharpest criticism was this: many agent logs "look complete when an incident occurs, but are actually useless."
This is an extremely real engineering dilemma. When an agent exhibits bizarre behavior at 3 AM, you open the logs and see walls of text, yet you can't quickly pinpoint: Which tool call returned dirty data? Which inference round misunderstood the user's intent? Which piece of context in the prompt caused a hallucination? There's a massive gap between log "completeness" and log "usefulness."
Core Capabilities Agent Observability Must Have
To truly debug anomalous agent behavior in production, an observability system needs to deliver on several dimensions:
End-to-End Tracing
This is the cornerstone of agent observability. The concepts of Traces and Spans originate from Google's Dapper paper published in 2010, which later became the standard paradigm for distributed systems observability. In microservice architectures, a single user request may pass through dozens of service nodes. A Trace links the entire call chain together, with each service processing step corresponding to a Span, and Spans forming a tree structure through parent-child relationships. The OpenTelemetry project later further standardized this approach, defining a unified Trace data model and propagation protocol.
When transplanting these concepts to the agent scenario, a complete agent task should be treated as a Trace, with every LLM call, every tool invocation, and every memory retrieval being a Span within it. Only by linking Spans into a tree or graph structure can you reconstruct the agent's actual "thought path" and precisely describe its decision topology.
Semantic-Level Visibility
Unlike microservice tracing, the content of agent Spans is semantic in nature. In traditional microservice tracing, Spans carry structured metadata: HTTP status codes, database query durations, message queue latencies — all numerical metrics that can be directly aggregated, compared, and used for alerting. Agent Span content is fundamentally different: Prompts and Completions are natural language text, tool call return values may be unstructured web content or document fragments, and decision rationale is the model's Chain-of-Thought.
You need to see:
- The full Prompt and Completion at every step
- Input parameters and return values of tool calls
- Token consumption and cost breakdowns
- The decision rationale at each step
This means the observability system needs not only to store and display this text, but also to possess semantic understanding capabilities — for example, using LLM-as-Judge (employing another LLM to evaluate output quality) or embedding vector similarity to automatically detect whether output deviates from expectations. Token consumption tracking is directly tied to cost control — with GPT-4-class models, a single complex agent task can consume tens of thousands of tokens, corresponding to several dollars in API costs, making precise token-level cost attribution critical for production operations.
Evaluation and Replay Capabilities
Recording alone isn't enough. Evaluation and replay capabilities draw from deterministic replay techniques in software engineering and offline evaluation methodologies in machine learning. In traditional software debugging, record-and-replay tools (like Mozilla rr) can capture all external inputs during program execution to precisely reproduce bugs later. The challenge in agent scenarios is that LLM inference itself is stochastic (controlled by the Temperature parameter), and external tool call return values change over time, so perfect deterministic replay requires simultaneously recording all LLM responses and tool return values.
An ideal system should support offline evaluation of historical Traces, and even the ability to replay a specific execution, modify a particular step, and re-run it to precisely locate root causes. Offline evaluation allows engineers to batch-run new evaluation criteria (such as factual accuracy checks or safety compliance audits) against historical Traces, discovering potential issues without re-executing the agent. This is crucial for building regression test frameworks and continuous quality monitoring.
Tooling Landscape: Build vs. Buy
Another core question from the original post was: "What does your stack look like? How much did you build vs. buy?" This is a decision every team must face.
Three Approaches to Specialized Tooling
Tools currently focused on LLM and agent observability fall roughly into three categories:
-
Open-source self-hosted solutions: LangFuse, Phoenix (Arize), and others provide trace collection, prompt management, and evaluation capabilities. These are ideal for teams that want data control and have limited budgets. LangFuse is one of the most active open-source LLM observability projects, offering trace collection, prompt version management, user feedback collection, and evaluation pipelines, with support for self-hosted deployment where data is stored entirely on the user's own infrastructure. Phoenix (open-sourced by Arize AI) focuses on experiment tracking and evaluation for LLM applications, complementing Arize's commercial ML monitoring platform. These tools share a common pattern of providing Python/TypeScript SDKs that capture LLM call data through decorators or context managers with minimal code intrusion, lowering the barrier to adoption.
-
Commercial SaaS solutions: LangSmith (official LangChain product), Helicone, Braintrust, and others offer out-of-the-box functionality with high integration levels.
-
Standards-based approach: Built on OpenTelemetry semantic conventions, this avoids vendor lock-in and reuses existing observability infrastructure (Grafana, Datadog, etc.). OpenTelemetry (OTel) is a flagship CNCF (Cloud Native Computing Foundation) project that has become the de facto standard for observability data collection. Its core value lies in decoupling data collection from backend storage — applications only need to integrate the OTel SDK, and the collected Traces, Metrics, and Logs can be sent to any compatible backend (Jaeger, Zipkin, Grafana Tempo, Datadog, New Relic, etc.). Since 2024, the OTel community has been developing GenAI Semantic Conventions, defining standardized attribute names for LLM calls (such as
gen_ai.system,gen_ai.request.model,gen_ai.usage.input_tokens, etc.), enabling agent tracing data to seamlessly integrate into an enterprise's existing observability infrastructure without maintaining a separate system for AI monitoring.
The Trade-offs of Building In-House
Teams typically choose to build in-house for the following reasons: highly customized agent business logic, strict data privacy and compliance requirements, or a desire to deeply integrate agent tracing into existing monitoring systems.
However, building in-house comes at a significant cost — you need to design the Trace data model, build a storage and query system, develop a visualization interface, and continuously maintain it all. For most teams, "building on top of open-source frameworks" is the most pragmatic compromise, reusing mature Trace infrastructure while retaining customization flexibility.
Four Key Recommendations for Implementation
Drawing from community discussions, here are key principles for building an agent observability system:
Center everything around Traces, not Logs. From the design phase, model every agent execution as a structured Trace rather than simply printing logs. Structured Traces naturally support causal analysis and waterfall visualizations, while flat log streams quickly become incomprehensible when facing complex decision chains.
Prioritize OpenTelemetry as your standard. This maximizes protection against vendor lock-in and unifies agent monitoring with existing infrastructure monitoring. Vendor lock-in is a recurring risk in enterprise technology decisions — in the observability space, different vendors' data formats and APIs are mutually incompatible, and once you're deeply committed to a specific commercial platform, migration costs are enormous. Adopting the OTel standard means a team can start with the Grafana Stack for local development and debugging, then smoothly transition to Datadog or a self-hosted ClickHouse solution as scale demands, without modifying application-level instrumentation code. This flexibility is especially valuable given the rapid iteration pace of AI engineering today.
Incorporate evaluation capabilities into the observability feedback loop. Observability isn't just about "reviewing logs after the fact" — it should support continuous evaluation of agent output quality, proactively identifying issues rather than reactively firefighting.
Buy first, build later — avoid premature infrastructure investment. In the early stages when business requirements are still taking shape, use mature open-source or commercial tools for rapid validation, and only consider building in-house when you hit real bottlenecks.
Final Thoughts
This discussion reveals a reality: Agent observability is far more complex than traditional model monitoring, and no silver-bullet solution exists in the market today. From single-point predictions to decision chains, from structured metrics to semantic tracing — this represents a fundamental paradigm shift in observability.
For teams pushing agents into production, rather than chasing logs that "look complete," it's far better to establish a Trace-centric, evaluation-driven observability system from day one. A system that can quickly pinpoint root causes when incidents occur — that's the system that's truly useful.
Related articles

Cursor AI Programming in Practice: Build a Student Management System from Scratch in 30 Minutes
A Bilibili creator demonstrates Cursor AI programming: generating a student management system in 30 minutes with natural language. Details on Agent mode, Claude selection, prompt techniques, and thresholds.

Top 20 AI Coding Tools Ranking: From Rock-Solid to Lackluster, a Scored Matrix
Bilibili creator releases top 20 AI coding tools ranking, tiered T0–T4 from rock-solid to lackluster, with Claude Code and Codex tied at T0. This article details the scoring dimensions (capability, reliability, robustness, durability, cost, domestic availability) and tool performances to help developers choose the right AI coding assistant.

Vibe Coding Systematic Tutorial: Master AI-Assisted Programming from Zero
A three-month Vibe Coding tutorial from a Bilibili creator covering Codex, ClaudeCode, and Cursor, from core logic to commercial project practice for beginners.