AI Agent Debugging Tool: Inspect Execution Chains Like Browser DevTools

An open-source debugging tool that brings Browser DevTools-style inspection to AI Agent execution chains.
Agent DevTools is an open-source project that applies the Browser DevTools philosophy to AI Agent debugging. It provides execution chain visualization, tool call tracing, failure diagnosis, and pause-and-analyze capabilities to address the unique challenges of debugging non-deterministic, multi-step LLM Agent workflows that traditional logging can't handle.
When Logs Are No Longer Enough: The AI Agent Debugging Dilemma
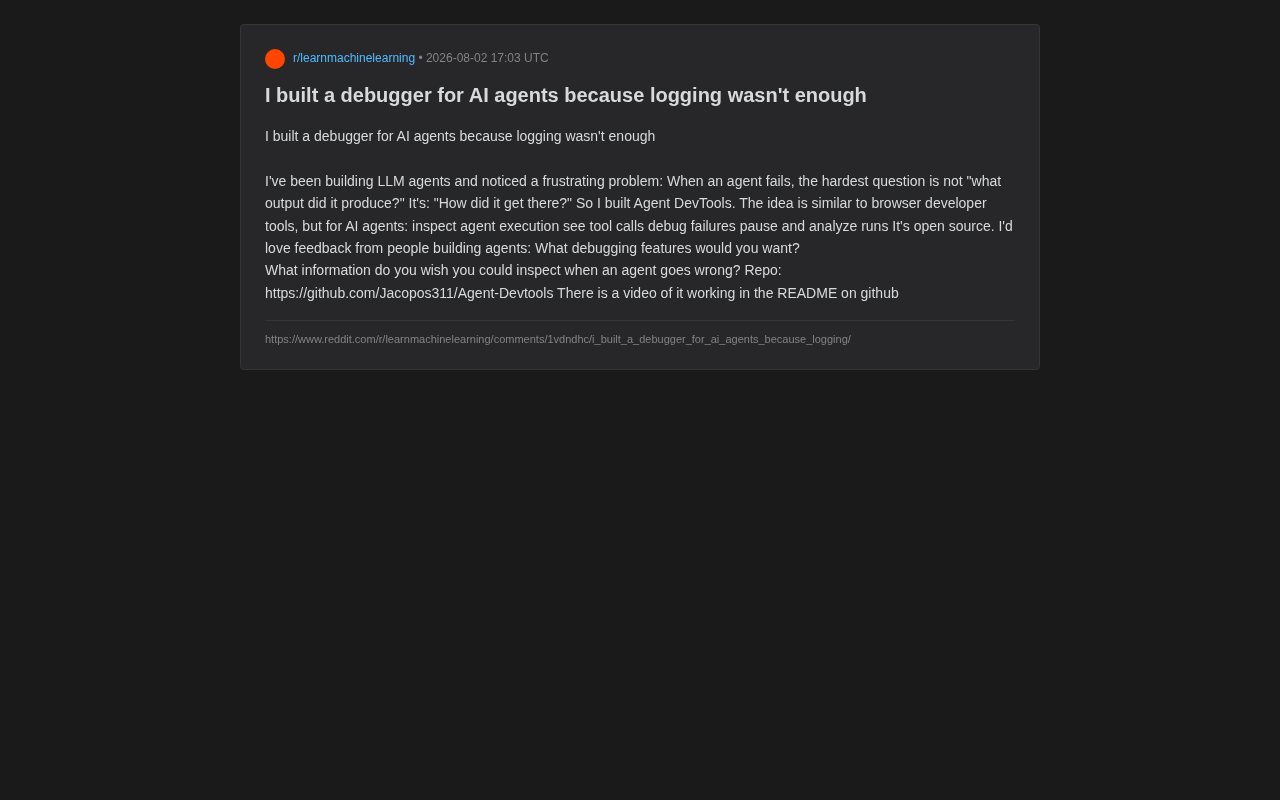
As Large Language Model (LLM) Agents become more widespread, developers are facing an increasingly thorny problem. Recently, a developer shared their solution on Reddit — Agent DevTools, an open-source debugging tool designed specifically for AI Agents.
This developer pinpointed the core pain point in current Agent development: When an Agent execution fails, the hardest question to answer isn't "what output did it produce," but rather "how did it get here step by step."
Traditional logging mechanisms fall short when dealing with AI Agents. Agent execution often involves multiple rounds of reasoning, tool calls, state passing, and conditional branching. Simply relying on print logs makes it nearly impossible to reconstruct the complete decision chain. When results go wrong, developers can only search for needles in a haystack of log text — an extremely inefficient process.
To understand this dilemma, you need to first grasp the basic operating mechanism of LLM Agents. Large language model Agents aren't simple Q&A systems — they're intelligent architectures capable of autonomous planning and multi-step task execution. A typical Agent execution loop includes: perception (receiving user instructions or environmental information), reasoning (using the LLM for thinking and planning), action (calling external tools or APIs), and observation (processing results returned by tools). This loop may execute repeatedly, forming what's known as the ReAct (Reasoning + Acting) pattern. It's precisely this multi-round iterative nature that makes Agent execution paths far more complex than traditional API calls, and makes simple logging insufficient to capture the full picture of their decision-making.
Agent DevTools: "Browser Developer Tools" for AI Agents
The design philosophy behind this project is quite clever — it draws inspiration from Browser DevTools, something every frontend developer knows intimately. Just as we use Chrome DevTools to inspect page elements, trace network requests, and debug JavaScript, Agent DevTools lets developers "see through" an AI Agent's internal operations with the same intuitive approach.
Core Features at a Glance
According to the author, Agent DevTools currently offers the following key capabilities:
- Inspect agent execution: Fully visualize the Agent's execution flow, not just the final result.
- See tool calls: Track which tools the Agent called during execution, what parameters were passed, and what results were returned.
- Debug failures: When an Agent behaves abnormally, pinpoint exactly which step went wrong.
- Pause and analyze runs: Similar to breakpoint debugging, pause at critical nodes and deeply analyze the state at that moment.
This feature set directly addresses the core needs of Agent development. Observability of tool calls is particularly important — modern Agents often rely on numerous external tools (search, code execution, API calls, etc.), and these calls are precisely where things most often go wrong.
Why AI Agent Debugging Tools Are Becoming Indispensable
From the perspective of technological evolution, the emergence of Agent DevTools isn't coincidental — it's an inevitable product of Agent development entering its "engineering" phase.
From Prompt Engineering to Agent Engineering
Early LLM applications were mostly single-turn "input-output" patterns where prompt tuning could solve most problems. But with the rise of Agentic workflows, application logic has become increasingly complex: multi-step reasoning, autonomous planning, dynamic tool selection, loops and retry mechanisms... All of these make "observability" a serious engineering challenge.
Observability is a core concept in distributed systems engineering, originally derived from control theory. In software engineering, it's typically built on three pillars: Logs, Metrics, and Distributed Traces. Logs record discrete events, metrics quantify system state, and traces reconstruct a request's complete path through the system. For AI Agents, these traditional three pillars need to be redefined — for example, "traces" are no longer call chains between microservices, but causal relationship chains between LLM reasoning steps. Standardized frameworks like OpenTelemetry are attempting to adapt to this new requirement, but observability standards for the Agent domain are still in early exploration stages.
The Debugging Challenge of Non-Determinism
LLM outputs are inherently non-deterministic — the same input may produce different execution paths. This means the traditional software debugging assumption of "reproducibility" no longer holds. Developers need not just recording, but visual reconstruction of the entire decision tree to understand why an Agent made an incorrect decision in a particular run.
This non-determinism stems from two levels: First, the sampling strategy during model inference (such as randomness controlled by the temperature parameter) — even with temperature set to 0, due to the parallelization characteristics of GPU floating-point operations, different hardware or batch sizes can still produce subtle numerical differences. Second, at the Agent framework level, when an Agent relies on real-time external data (such as search results or API responses), the same prompt receives different contextual information at different points in time, causing subsequent decision chains to diverge completely. This dual non-determinism renders the traditional "record inputs, reproduce bugs" debugging paradigm nearly useless — developers must rely on complete runtime state snapshots for post-hoc analysis.
The "pause and analyze" feature provided by Agent DevTools is an effective approach to handling this non-determinism. It allows developers to set observation points in the Agent's reasoning chain and systematically dissect the context at each decision node.
Positioning in the Open-Source Ecosystem and Competitor Comparison
You might not have noticed, but this project adopts an open-source model, with code hosted on GitHub (Jacopos311/Agent-Devtools), and the README includes a demo video of actual operation.
The open-source strategy is particularly critical for this type of developer tool. The value of debugging tools is highly dependent on compatibility with various Agent frameworks and community feedback. The author also actively solicited community input in the post, posing two open-ended questions:
"What debugging features would you like to have? When an Agent goes wrong, what information do you most want to inspect?"
This community-needs-driven development approach often helps tools align more closely with real pain points. The current market already has commercialized or semi-open-source Agent observability solutions like LangSmith, LangFuse, and AgentOps, but a lightweight, open-source tool focused on the "debugging experience" still has its unique niche — especially for independent developers who don't want to be locked into a specific platform.
Looking specifically at the technical differences between these competitors: LangSmith is a commercial observability platform from the LangChain team, deeply tied to the LangChain ecosystem, offering full-chain tracing from development to production. LangFuse is an open-source alternative supporting multi-framework integration, focusing on cost analysis and prompt management. AgentOps specializes in real-time monitoring and alerting for Agents in production environments. Most of these solutions position themselves as "platform-level" products requiring data upload to the cloud or self-hosted servers. In contrast, Agent DevTools takes a "local-first, lightweight embedding" approach, more akin to an IDE plugin for the development phase rather than a production monitoring platform, filling the experience gap in the development debugging workflow.
Best Practices and Insights for AI Agent Debugging
For developers currently building Agents, this project offers at least a few key insights:
First, observability should be designed upfront. Rather than scrambling to add logs after an Agent breaks, it's better to introduce structured execution tracing mechanisms from the architectural level.
Second, the "interactivity" of debugging tools is the core competitive advantage. Between static logs and pausable, rewindable interactive debugging, there's an enormous experiential gap. The former is data; the latter is a true "tool."
Third, tool calls are the danger zone. Most Agent failures occur at the boundary of interaction with the external world, and fine-grained monitoring of tool calls deserves more investment. Agent tool call failures typically fall into several common patterns: parameter construction errors (the LLM generates parameters that don't conform to the tool's schema), tool selection errors (choosing a tool unsuitable for the current task), result parsing failures (the tool returns a format beyond the LLM's comprehension), and cascading failures (erroneous results from a previous tool call are amplified by subsequent steps). Standardized interfaces like OpenAI's Function Calling and Anthropic's Tool Use have reduced integration difficulty but haven't solved semantic-level runtime errors. Fine-grained tool call monitoring needs to simultaneously record calling intent, actual parameters, raw responses, and the LLM's interpretation of responses to fully reconstruct the fault scene.
Conclusion
Agent DevTools may still be an early-stage project, but it reflects a trend that's taking shape: as AI Agents move from demos to production environments, the engineering infrastructure surrounding them is rapidly filling in. Debugging, monitoring, evaluation, tracing — capabilities taken for granted in traditional software engineering are being reinvented in the AI Agent domain.
For developers in the midst of this, rather than struggling in an ocean of logs, it's better to embrace these emerging debugging tools. After all, understanding how an Agent thinks may be more important than knowing what it thought.
Related articles
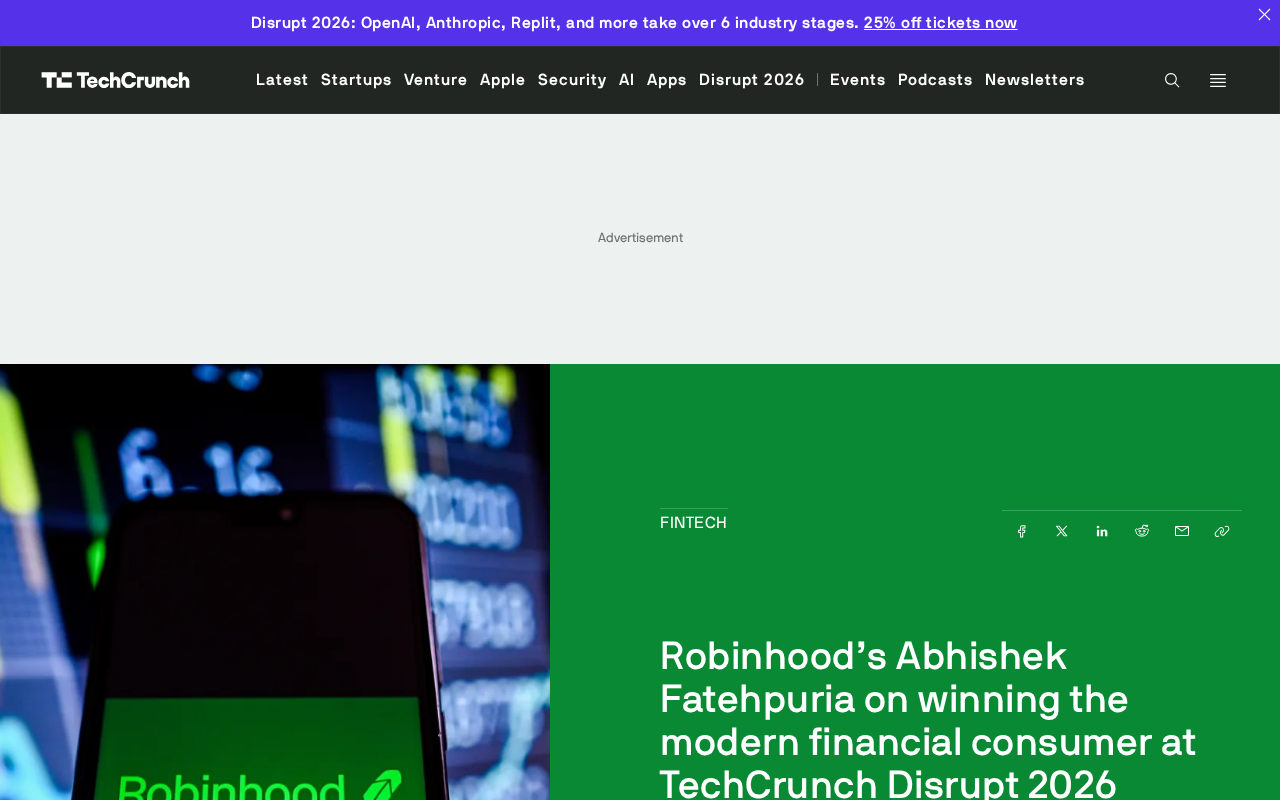
Robinhood Executive to Speak at TechCrunch Disrupt 2026 on Winning the Modern Financial Consumer
Robinhood VP of Product Marketing Abhishek Fatehpuria will speak at TechCrunch Disrupt 2026 on winning the modern financial consumer. Early-bird saves up to $200 before Sept 25.
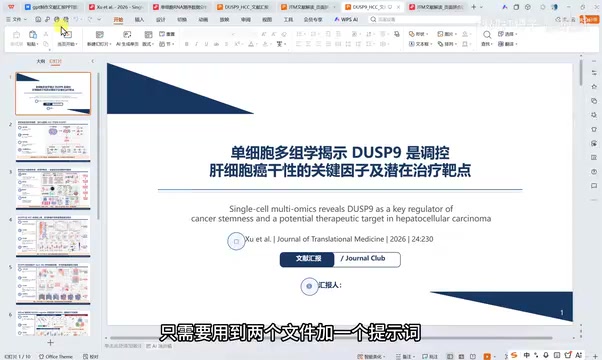
Using ChatGPT to Batch-Generate Editable Academic Slides: A Practical Efficiency Tool for Researchers
A complete workflow for batch-generating editable academic PPTs with ChatGPT: upload a PDF and template, use a structured prompt to render slides as images, then convert to editable format — all in under 30 minutes.
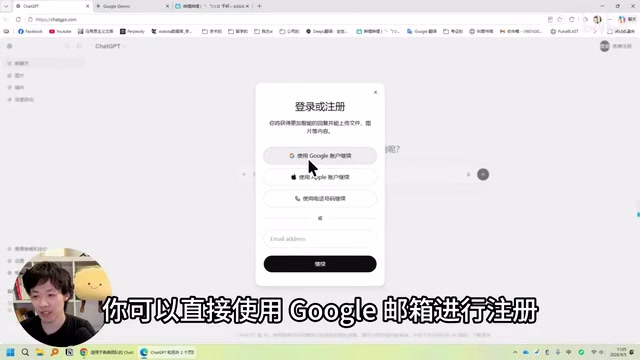
GPT-6 Full Power Guide: Unlocking Ultra Thinking Intensity via GPT-work
Step-by-step guide to using GPT-6 at full power: Apple ID registration, Plus/Pro subscription, and unlocking GPT-6 Ultra max thinking intensity via GPT-work client.