Anthropic SDK v1.14.0 Released: OpenTelemetry Tracing Now Available

Anthropic SDK v1.14.0 focuses on observability and stability, adding OTel tracing and expanding Admin API telemetry.
Anthropic's official SDK released v1.14.0 with no breaking API changes, focusing on observability and admin enhancements. The client now natively supports OpenTelemetry across API calls, streaming, and tool execution, enabling unified distributed tracing. The Admin API adds telemetry destination configuration and test endpoints, plus fixes model naming in test responses. Streaming fixes handle unknown event types via pass-through and stop throwing exceptions for events before message_start. This engineering-oriented iteration delivers strong value for production teams.
What Anthropic SDK v1.14.0 Brings
Anthropic's official SDK has released version v1.14.0 (published by the account anthropic-sdks-releaser). This update doesn't introduce any disruptive API changes, but it makes several substantive enhancements around observability and admin console capabilities.
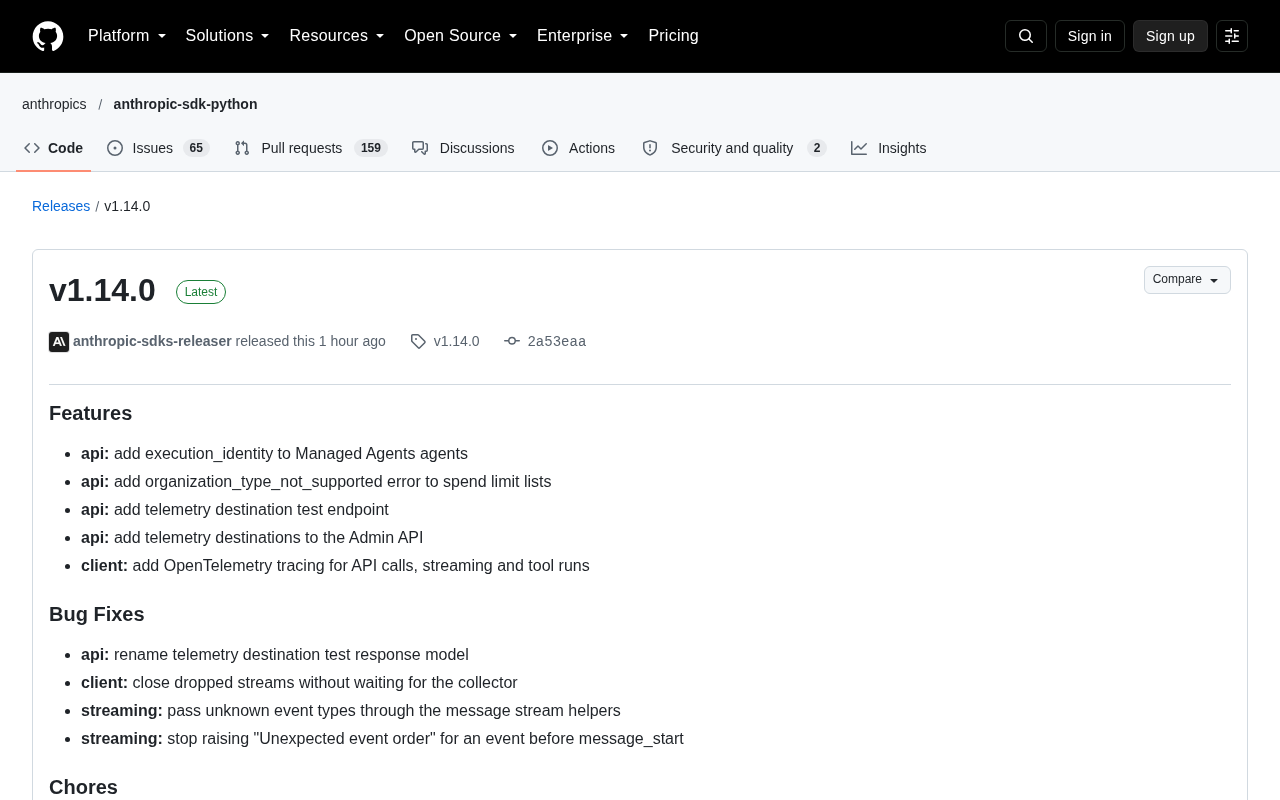
For teams integrating Claude into production systems, the most noteworthy change is that the client now natively supports OpenTelemetry tracing.
OpenTelemetry Tracing Comes to the Client
The official changelog explicitly states: client: add OpenTelemetry tracing for API calls, streaming and tool runs. This means tracing data can now be generated for three critical paths: API calls, streaming responses, and tool execution. Developers can directly feed the SDK's telemetry data into their existing OTel collection pipeline without having to manually instrument their code.
For engineering teams already using the OpenTelemetry ecosystem, the value of this change lies in unifying the trace chain. Previously, tracking a complete Claude invocation often required instrumenting on the business side and then stitching it together with downstream service calls — tool invocations and streaming chunks were especially prone to broken chains. Now that all three types of operations generate tracing data at the SDK level, distributed tracing completeness will be significantly improved.
What is OpenTelemetry (OTel)
OpenTelemetry is an open-source observability framework under the CNCF, aiming to unify telemetry data collection standards across distributed systems. It consists of three main components: Traces, Metrics, and Logs. Traces, in particular, use Spans and Trace IDs to connect the execution path of a single request across multiple services and components, forming a call chain.
OTel's core value lies in vendor neutrality: applications only need to produce data according to the specification, which is then exported via the OTLP protocol to any backend such as Jaeger, Tempo, Datadog, or Honeycomb — no need to re-instrument for different observability platforms. For LLM applications, a single request often includes API calls, streaming chunks, and tool execution stages, making it a natural fit for Trace representation. Native OTel support in the SDK means these stages are directly converted into standard Spans, allowing teams to reuse existing sampling, alerting, and visualization systems without building custom instrumentation protocols.
Admin API Adds Telemetry and Spend Limit Capabilities
The Admin API side also sees extensions. The changelog lists three telemetry-related changes: new telemetry destinations, a new test endpoint for telemetry destinations, and a fix for the model naming in test responses.
Inferring from the product logic, this set of changes is designed to let enterprise administrators configure telemetry data receiving endpoints in the backend and verify connectivity through a test interface, rather than relying on informal channels to confirm whether configurations are working. Combined with the client-side OTel support, Anthropic has adopted a division of labor on the telemetry chain: "client produces + admin configures."
The same batch of API changes also includes an error type related to spend limits, organization_type_not_supported, and documentation clarifying that the user spend limit's is_enabled field is always true. These details mainly affect developers working on quota management and billing monitoring.
Telemetry Destinations and OTLP Receiving Endpoints
A "telemetry destination" typically refers to a configurable receiving address used to accept tracing and metrics data generated by the SDK or server. The most common form in the industry is an OTLP (OpenTelemetry Protocol) endpoint, such as a self-hosted Collector, a cloud vendor's observability service entry point, or an internal gateway. After administrators register the endpoint in the Admin API, Spans generated by the SDK can be uniformly exported without each application maintaining its own configuration files.
The newly added "test endpoint" addresses the configuration verification problem: operations teams can send a probe request first to confirm network connectivity, correct authentication, and that the target can properly receive data, before switching over production traffic. Such test interfaces are very practical in enterprise procurement scenarios, significantly reducing the troubleshooting cost of "configuration looks successful but data isn't actually arriving," and avoiding the awkwardness of guessing configuration status through workarounds.
What Edge Cases Do the Streaming Fixes Address
Two of the Bug Fixes in this release are directly related to streaming and deserve separate mention.
First: streaming: pass unknown event types through the message stream helpers. The old behavior could interrupt or swallow information when encountering unrecognized event types; the new version chooses to pass them through, leaving room for compatibility as the server adds new event types in the future.
Second: streaming: stop raising "Unexpected event order" for an event before message_start. Previously, if an event arrived before message_start, the client would throw an exception directly; this behavior has now been removed. For scenarios with unstable network conditions where event arrival order may vary, this is a pragmatic fault-tolerance improvement.
Additionally, client: close dropped streams without waiting for the collector is also a stability fix, addressing the issue where discarded streams could hang while waiting for the collector.
message_start and SSE Event Ordering
Anthropic's streaming interface is based on Server-Sent Events (SSE), where the server progressively delivers content in event sequences. By convention, the message_start event marks the beginning of a message stream, followed by content blocks, tool calls, and other events. The client's state machine typically relies on this preceding event to initialize context, which is why older versions would throw an "Unexpected event order" exception when receiving an event before message_start.
However, in real network environments, multiplexing, proxy forwarding, or retry mechanisms can all cause event arrival order to differ from send order. Throwing an exception directly would fail the entire stream at too high a cost. The new version removes this restriction, meaning the client is more tolerant of ordering jitter. Meanwhile, "passing through unknown event types" is a forward-looking compatibility design — when the server adds new event types, old clients won't crash or lose data because they don't recognize them, which is especially important for long-running production services.
How Developers Can Use These Updates
If your project already uses OpenTelemetry, after upgrading you can incorporate Claude-related calls into a unified tracing view. This is particularly useful when troubleshooting tool call latency or streaming response interruptions — tracing data is more intuitive than logs.
If your team relies on the Admin API for telemetry configuration, it's recommended to first verify target reachability through the new test endpoint before integrating it into production.
Note that this update does not provide SDK version compatibility notes or a list of breaking changes. Before upgrading, it's advisable to validate the streaming changes in a small-scale environment to confirm they behave as expected.
Overall, v1.14.0 is an engineering-oriented iteration: it doesn't chase new feature exposure but fills in gaps in observability and operations. For teams running Claude in production workloads, the practical value of such updates often exceeds that of new features.
One-line Summary
Anthropic SDK v1.14.0 focuses on observability and stability, adding OTel tracing and expanding Admin API telemetry capabilities.
Paragraph Summary
Anthropic's official SDK has released v1.14.0 with no breaking API changes, focusing on observability and admin console enhancements. The client now natively supports OpenTelemetry, covering API calls, streaming responses, and tool execution — developers can feed telemetry data directly into existing OTel pipelines for unified distributed tracing. The Admin API adds telemetry destination configuration and a test endpoint, and fixes model naming in test responses, forming a "client produces + admin configures" division of labor. Streaming fixes address two edge cases: unknown event types are now passed through, and events arriving before message_start no longer throw exceptions, improving fault tolerance under network jitter. Spend limit-related error types and documentation have also been adjusted. Overall, this is an engineering-oriented iteration with standout value for production teams.
Related articles

Free Unlimited Claude Code Solution: Agnes AI + CC Switch Setup Guide
No paid subscription needed — pair the free AI platform Agnes AI with the open-source tool CC Switch to provide a backend for Claude Code, enabling unlimited free calls to text, image, and video models. This guide covers the full setup, test results, and usage boundaries.

A Complete Zero-Cost Guide to Getting Started with Claude Code for Beginners in China
A beginner's guide to Claude Code for users in China: two installation methods (command line and IDE plugin), full configuration steps for replacing the official API with the free domestic LongCat model, and a hands-on demo of building a small tool with natural language, plus tips.

When the NSA Gets Involved: The AI Supply Chain Crisis Behind Open-Source CVEs and API Key Hijacking
Multiple open-source projects disclosed severe CVEs in one day, PHP flaws alarmed the FBI, and Railway and OpenCode were breached with API keys stolen. This article breaks down the vulnerability window, AI-accelerated exploitation, and the AI supply chain crisis behind the API key black market, with a developer defense checklist.